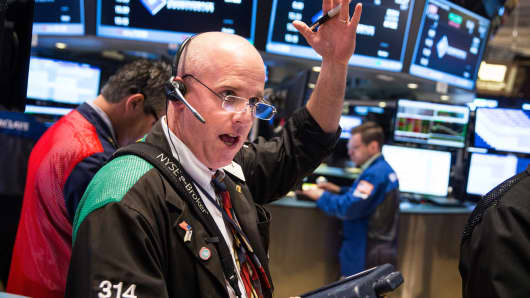
After months of daily debate about precisely when the Federal Reserve will begin raising interest rates, a conversation that has included every possible prognostication from June to "maybe during 2016," the bond market finally seems to be tangibly wrapping its head around the inevitability of an upcoming rate-hiking cycle.
This can be seen in a simple daily closing yield chart of the U.S. 10-year Treasury note, which shows that these benchmark yields have recently risen above their 200-day moving average, a widely watched major trend proxy, for the first time in more than a year.


