The U.S. Federal Open Market Committee (FOMC) meeting this week will drive the U.S. dollar movements. The direction of the movement is not yet clear in the chart analysis. The potential limits for the reactions are more clearly defined.
This highlights some important issues regrading the use of charts in analysis. They are first and foremost a tool for identifying the balance of probability of one reaction over another. Sometimes the balance is clearly tipped in one direction. This is shown with clear chart reversal patterns such as a head and shoulder, a rounding top, or the break below a key support level or trend line.
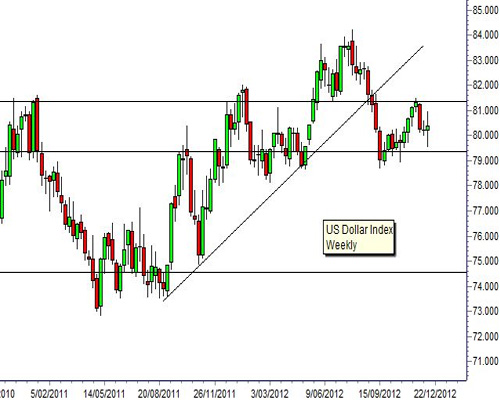
There are no well-established chart patterns on the U.S. Dollar Index, however there are well defined support and resistance levels.
The index is a basket of currencies comprising the euro, yen, British pound, Canadian dollar, Swiss Franc and Swedish Krona. The index is used as a measure of the strength or weakness of the U.S. dollar.
The second use of chart analysis is to identify trip points where a market moves into a new phase. This may be a trend line. A close below the trend line signals the end of the uptrend and the beginning of a new downtrend. With the dollar index these trip points are set by the historical support and resistance levels. A move above or below these levels confirms a significant change in the trending behavior. Traders use this as a signal to take new positions.