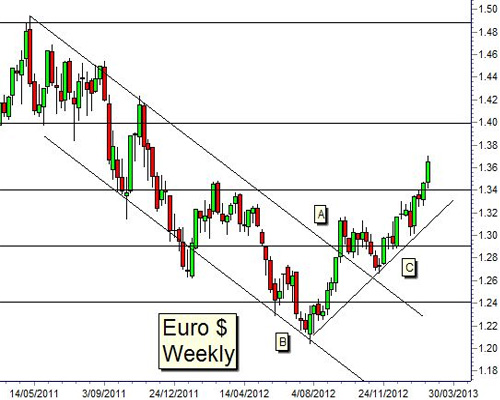
The euro/dollar chart is a story of trend and well established support and resistance levels. The trending behavior carries the euro/dollar between the support and resistance levels. The trends are interrupted by consolidation behavior at the support and resistance levels. This combination of behavior is best seen on the weekly chart.
Starting May 2011, the euro/dollar moved in a downward sloping trading channel. This is defined by the trend lines A and B. In September 2012, the euro/dollar staged the first breakout above the upper edge of the channel, trend line A. This line was used as a support level with a rebound in November 2012 from $1.27. This rebound point provided the anchor point for the new uptrend trend line C.
Up trend line C has accurately defined the rising euro/dollar trend with successful tests and rebounds in January 2013. There is a high probability that any retreat in the euro/dollar will find support at or near this uptrend line.
(Read More: This Euro Rally Could Keep Going for a While)
The trend movement has been constrained by the strong support and resistance area near $1.29. The market consolidated around this level before moving to resistance near $1.34. The breakout above $1.34 has been strong despite the historical strength of this level as a support and resistance feature. This suggests a high probability of a retreat and retest consolidation of this level. This is a strong level, so a test and retest is not a signal to go short.