


If it feels like the economic data has been jerking the market around, that's because it has.
CNBC looked at all the economic data that's come out in the past several weeks and found it to be seriously mixed, that is, strongly positive and strongly negative. We call this our better/better, worse/worse list. To make the list, a data point has to be better or worse than the consensus AND better or worse than the prior report. The findings: As of Friday morning, six indicators make the better/better list and six make the worse/worse list.
The differences are enough to leave an investor highly confused. Leading the better/better list is the April jobs report with its out-sized job growth of 288,000. It handily beat the 215,000 consensus and the prior month's 203,000. Jobless claims are also better/better. But retail sales came in with just a 0.1 percent gain, missing the 0.4 percent consensus and the prior month's 1.5 percent gain. Many economists have said that the prior-month's strength offset the downside surprise in April but they would have felt more confident in a strong growth outlook if some of the momentum had spilled over.
| Better/Better | Worse /Worse |
|---|---|
| Payrolls | Industrial Production |
| Jobless Claims | Retail Sales |
| NFIB | GDP |
| ISM Manufacturing | NAHB |
| ISM Services | Vehicle Sales |
| Empire State | |
Source: Source: CNBC/Steve Liesman
Even indicators from the same industry show a split. The NAHB Housing Market Index makes the worse/worse list, but Friday morning's housing start figure, topping one million on the strength mostly of multi-family homes, registers in the better/better column.
Read MoreHousing starts surge, yes, but mostly for apartments
Equally vexing is that most of the hard data—that is, actual tallies of economic activity—like retail sales and GDP, are in the worse column. But the better column so far has largely soft or survey data, like the NFIB Small Business Optimism Index and the ISM Survey data, which is seen as more forward-looking.

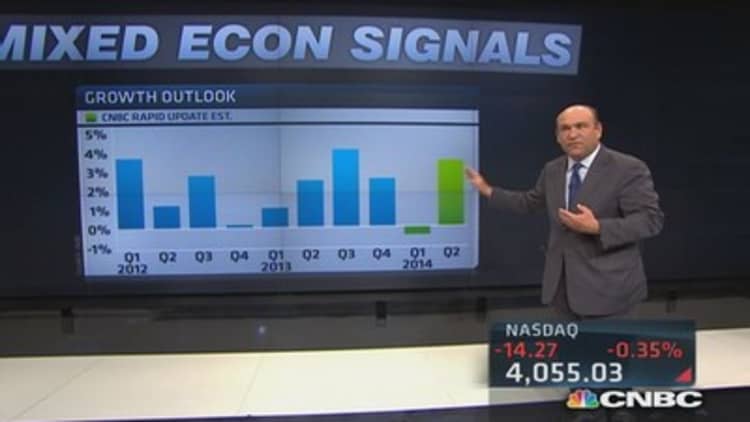
The muddle of data on balance support the notion of a weak first quarter and a stronger second quarter. But unless more of it starts to turn decisively positive, such as the upcoming durable goods report, the strength of the second quarter rebound will be called into question. The CNBC Rapid Update shows first quarter GDP tracking at -0.4 percent and the second quarter at 3.7 percent. Both have remained mostly unchanged through the week, showing how the mixed data has largely been offsetting..
—By CNBC's Steve Liesman. Follow him on Twitter: @steveliesman