Market 360: The Week's Best & Worst

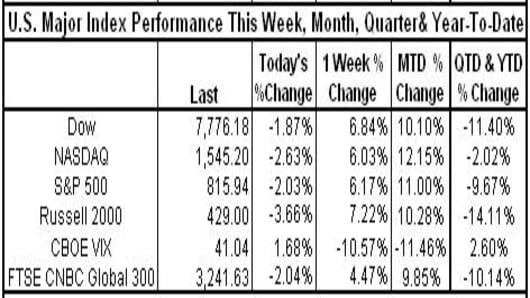
On a week dominated by the toxic asset plan, better-than-expected housing and durable goods data, the markets rally through their third straight week of gains. The last time all major indices rose for three consecutive weeks was the week ending May 2, 2008.

  • The Dow and NASDAQ are on track for their best monthly gains since October 2002
  • The S&P is on track for the best monthly gain since December 1991
  • The NASDAQ 100 is now positive for 2009, up 3.29% YTD
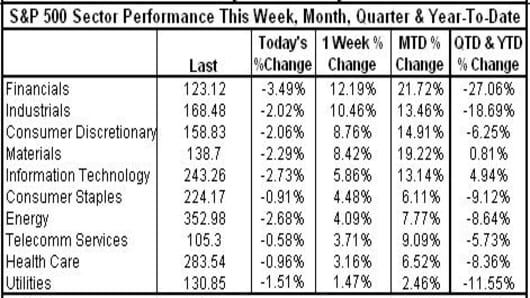
  • Information Technology and Materials Sector are now both positive in 2009, up nearly 5% and 1% respectively
  • Since the March 9th lows, the Dow is up 18.77%, the NASDAQ is up 21.80% and the S&P is up 20.61%

Index Impact:

-Boeing
(BA) had the most positive impact on the Dow, up over 15% for the week
**YTD, GM (GM) is once again the top performer by % gain, up over 13% YTD, joined by IBM (IBM), Intel (INTC) and Home Depot (HD) which are now all positive YTD.
-Citigroup (C) had the most negative impact on the Dow flat for the week (The other 29 Dow components were positive for the week)
**YTD, Citigroup (C) continues to be the worst Dow performer by % loss, down almost 61% YTD
-Exxon (XOM) had the most positive impact on the S&P 500 up almost 6% for the week.
**YTD, the top S&P performer by % gain is SprintNextel (S), up over 116% YTD
-Philip Morris (PM) had the most negative impact on the S&P 500, down over 2% for the week.
**YTD, the bottom S&P performer by % loss continues to be Huntington Bancshares (HBAN) down over 78% YTD
-Microsoft (MSFT) had the most positive impact on the NASDAQ 100 up over 6% for the week.
**YTD, the top NASDAQ 100 performer by % gain continues to be SunMicrosystems (JAVA), up almost 105% YTD
-Express Scripts (ESRX) had the most negative impact on the NASDAQ 100, down almost 6% for the week.
**YTD, the worst NASDAQ 100 performer by % loss continues to be Wynn Resorts (WYNN), down over 49% YTD

No Title_29919641


Sector Impact:

10 out of 10 S&P sectors were positive for the week led by Financials up over 12%. Utilities were the least positive sector, up only about 1.5% for the week.
Financials were helped by CB Richard Ellis (CBG), up over 80% for the week.
Utilities were hurt by Dynegy (DYN), down almost 13% for the week

  • Month-to-date, 10 out of 10 sectors are positive led by Financials up almost 22% MTD
  • Year-to-date, 8 out of 10 sectors are negative led by Financials down over 27% YTD.
  • Information Technology is the most positive sector up almost 5% YTD, followed by Materials up almost 1% YTD


No Title_29919636


More Weekly Stats Here


Commodity Impact:
Oil settled at $52.38 per barrel, down about 11.71% month-to-date. Natural gas fell to a nearly seven-year low, as energy spending by industrial customers declined while supplies increased for the week.
Gas Prices: The AAA current national average for regular gas is $2.026 per gallon down 37.99% from a year ago, when the average was $3.267 per gallon.
-The highest recorded average price by AAA was on 7/17/2008, when the national average was $4.114 per gallon

No Title_29919646


Currency Impact:

The US dollar gained against the euro during Friday's trading session, as traders increasingly think that that the European Central Bank may need to move towards "quantitative easing" to stimulate the European economy. The ECB will meet next Thursday to decide on interest rates. The forex market will also watch closely the G20 meeting next week.


Commodity Impact:
Oil settled at $52.38 per barrel, down about 11.71% month-to-date. Natural gas fell to a nearly seven-year low, as energy spending by industrial customers declined while supplies increased for the week.
Gas Prices: The AAA current national average for regular gas is $2.026 per gallon down 37.99% from a year ago, when the average was $3.267 per gallon.
-The highest recorded average price by AAA was on 7/17/2008, when the national average was $4.114 per gallon

No Title_29919648


Note:Data based on preliminary numbers. May adjust slightly due to settling at close.

Comments? Suggestions? Send them tobythenumbers@cnbc.com

Bythenumbers.cnbc.com