"Correction" is a term that gets used increasingly loosely in stock market talk, to where it's becoming applied to every 2 percent or 3 percent selloff that happens these days.
Truth is, though, the stock market hasn't had a real correction—a drop between 10 percent and 20 percent—in more than two years.
That's been 516 trading days, during which the stock market has weathered a European recession, a U.S. government shutdown, a fiscal cliff and sequestration, a presidential election—a daunting menu of landmines that would have tripped up many other bull markets.
But not this one.

Instead, the has rallied nearly 60 percent since the last correction and through all those scary headwinds.
(Read more: Wall Street not listening to Washington anymore)
An outpouring of liquidity and basement-level interest rates from the Federal Reserve, as well as a modestly improving economy and corporate profits boosted through aggressive cost-cutting have driven the market higher.
It seems, nothing can move it lower.
That, though, is both the good news and the bad news.
In the past 25 years, the market has seen two such irrepressible bulls, and both ended, well, abruptly. Both lasted considerably longer than the current run, and the end of the last major run was notable for its destruction.
(Read more: Repeatedly burned, short sellers get gun-shy)
The longer of the two also had an October-to-October run, in that case from 1990 to 1997, encompassing 1,767 trading days, according to research from Bespoke Investment Group.
That bull ended with the infamous minicrash of Oct. 27, 1997, which began in Asia and caused a single-day 7 percent drop in the U.S. market. Of course, the bright side is the worst was still a few years off for the market, with big gains in 1998 and 1999 before a three-year bear that began in 2000.
The end of the second run was far more brutal.
The March 2003 to October 2007 surge—yes, there's a definite October theme here—ended with a colossal thud, ushering in a brutal bear run that would see the market lose about 60 percent of its value before the Fed stepped in and the financial crisis subsided.
In those two other runs, as now, there were few naysayers in sight.
Money has been rolling into stocks this year, with exchange-traded funds that focus on stocks taking in $10.5 billion last week. The ETF alone has seen inflows of more than $8.2 billion in 2013, according to IndexUniverse.
(Read more: ETF investors are making a hugely bullish bet)
Sentiment surveys also show equity investors are all-in.
The American Association of Individual Investors' most recent survey had bulls outnumbering bears 46 percent to 29 percent, while Investors Intelligence has the gap at 42 percent to 22 percent.
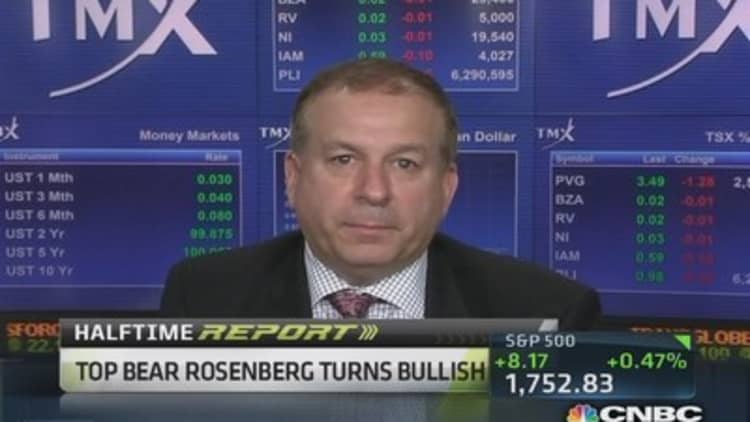
(Read more: Why a top market bear is turning bullish)
So while history hasn't been particularly kind to unbridled optimism, investors seem well inclined to take their chances.
As Bespoke's Paul Hickey pointed out, bull markets can run a long time without a correction.
"The current streak would have to extend all the way out to October 1st, 2018 to match" the 1990-97 record, he said in a note. "By then we'd be approaching the first mid-term elections of our next president and a full year past the end of Alex Rodriguez's seemingly never-ending 10-year Yankees contract!"
—By CNBC's Jeff Cox. Follow him on Twitter @JeffCoxCNBCcom.


