


If chart patterns are to be believed, one car maker is about to peel out and head higher.
The stock is Tesla and according to technical analysis from Dan Fitzpatrick, a colleague of Jim Cramer's at RealMoney.com, it's one of three stocks that could be looking to accelerate.
Following is Fitzpatrick's analysis:
Tesla
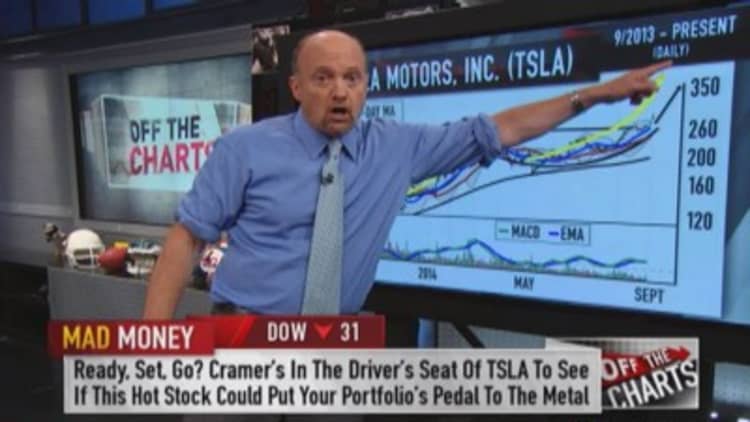
Looking at the daily chart of Tesla, Fitzpatrick notes that the stock made a 52-week high of about $255 in February before paring gains. However, with shares recently breaking above that key level, Fitzpatrick believes Telsa was simply consolidating for six months, or trading sideways, in turn, forming a classic cup and handle pattern.
That's a pattern that often manifests before the next leg higher. How high can Tesla rally from here?
Technical analysis suggests the forthcoming rally could be predicated on the advance from the last time the stock made an all-time high; which involved a 37 percent advance.
If this same pattern repeats, resulting in another 37 percent move, then Fitzpatrick believes Tesla can rally to $370 before it runs out of steam.
And, a second method of measurement confirms the outlook. Looking at the distance from the bottom of the cup, to the top of the cup, Fitzpatrick thinks Tesla could easily rally 25 percent.
Whether it's ultimately 37 percent of upside or 25 percent, either way, Fitzpatrick thinks that Tesla is a raging buy right now.
Looking at the daily chart of Facebook, Fitzpatrick sees a similarly bullish cup and handle pattern.
In this case, Facebook peaked in early March and then pulled back to $55. For the next few months the stock churned its way higher before ultimately breaking through to a new high in July. That forms the cup.
Since its July breakout, Facebook had been trading sideways, consolidating to make a tight handle. As in the case of Tesla, this cup and handle formation is viewed as incredibly positive by technicians.
Fitzpatrick thinks that once Facebook gets going and breaks out from the handle, the stock could soar all of the way to $100 before running into another ceiling of resistance.
JC Penney
On August 7th, for Mad Money's chart week, Fitzpatrick said that JC Penney was a buy due to an inverse head and shoulders pattern, a very bullish manifest.
At the time Fitzpatrick said if JC Penney could break out above $10, then, at a minimum, it could rally all the way up to $15.
When JC Penney reported a couple of weeks ago, it fulfilled its promise, breaking above that key $10 level, however, since that time it's also started to pullback.
Although shares may decline, Fitzpatrick isn't worried.
Fitzpatrick says the stock is making a so-called throwback, in which it re-tests key levels. However, based on the inverse head and shoulders pattern in the weekly chart, Fitzpatrick is standing by his $15 price target for JC Penney. He thinks it's a buy on any weakness, with a strong floor of support at $10.
-------------------------------------------------------------
Read more from Mad Money with Jim Cramer
Self-critical, Cramer reveals big stock regret
Cramer's draconian rule that really drives profits
Despite new highs, Cramer spots a bargain stock
-------------------------------------------------------------
(Click for video of this Mad Money segment)
Call Cramer: 1-800-743-CNBC
Questions for Cramer? madmoney@cnbc.com
Questions, comments, suggestions for the "Mad Money" website? madcap@cnbc.com