


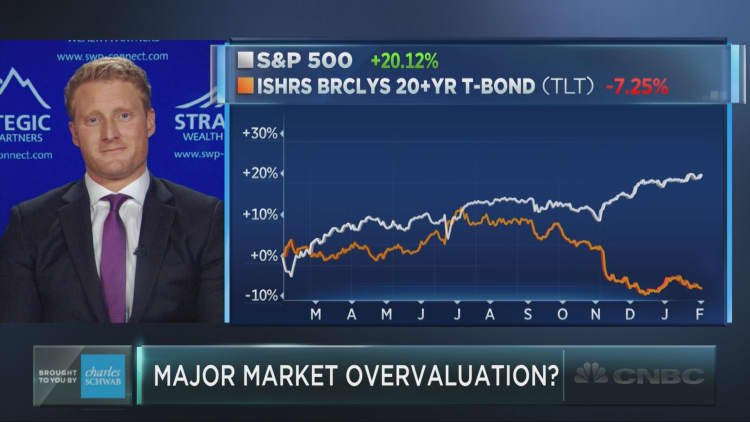
Market valuation can be measured in many ways, but one comparison of equity values to economic output yields a troubling conclusion.
Right now, the total market cap of the Wilshire 5000 index as a percentage of U.S. gross domestic product is about 120 percent, far above the 45-year average of 75 percent. To some, this indicates that stocks are priced too richly, and hence may not be a good buy at these levels.
"The issue with that is even if we were to see exceptionally fast growth over the course of the next eight years to the tune of 8 percent nominal GDP growth per year, we would still be at 80 percent market cap to GDP, which still puts us above that long-term average," Mark Tepper, president of Strategic Wealth Partners, said Friday on CNBC's "Trading Nation."
A version of this model is said to be one of investor Warren Buffett's go-to market valuation measures, sometimes called the "Buffett indicator," in which the broad Wilshire 5000 index is divided by the gross national product (as opposed to gross domestic product), and takes into consideration activity done abroad by U.S. companies. Interestingly enough, this model shows the ratio is below its 2000 peak of nearly 1.4, while the Wilshire 5000 index compared to GDP is far above its 2000 peak.
While others have also pointed to this metric to show overvaluation, comparing market capitalization to GDP is a flawed approach, according to John Canally, chief economic strategist at LPL Financial. Canally turns attention to the sizable swath of business done abroad by S&P 500 firms.
Comparing the total value of stocks to GDP is "not fair, unless [it's] comparing US market cap to global GDP rather than just U.S. GDP, since roughly 40% of sales and earnings come from overseas," Canally wrote in an email to CNBC.
Interestingly, this may make investors more interested in the comparison between the market cap value of the Wilshire 5000 and gross national product, which takes into consideration business done abroad by American companies (while excluding activity that occurs in U.S. borders but is directed by non-Americans). In 2001, Warren Buffett called the Wilshire-to-GNP ratio "probably the best single measure of where valuations stand at any given moment."
Canally, meanwhile, is more interested in the commonly used comparisons between equity values and earnings.
Market valuation metrics generally provide "very little information about what stock returns will be over the next year," but are good indicators of longer-term returns, Canally said. He added that the "slightly above average valuations" on the S&P 500 today suggest below-average returns over the next decade.
To Stacey Gilbert, head of derivative strategy at Susquehanna, there's little edge to be gained by studying different valuation metrics.
"We know from a [price-to-earnings] valuation here that the S&P 500 looks rich relative to where it's historically treated," Gilbert said Friday on CNBC's "Trading Nation." At the same time, the markets themselves "know a lot of the historical information and they know a lot of these metrics, and they say OK, and move forward. And they're kind of incorporating that into their prices here."
Gilbert points out that based on the low prices of options, there does not appear to be a great deal of concern embedded in equities, despite the fact that valuations are a bit elevated.
"I would say the market is not pricing in a significant concern for this year," she said. "Go out five years, it may be a different story, but this year, I think right now the market is saying, 'OK, let's see what happens.'"


