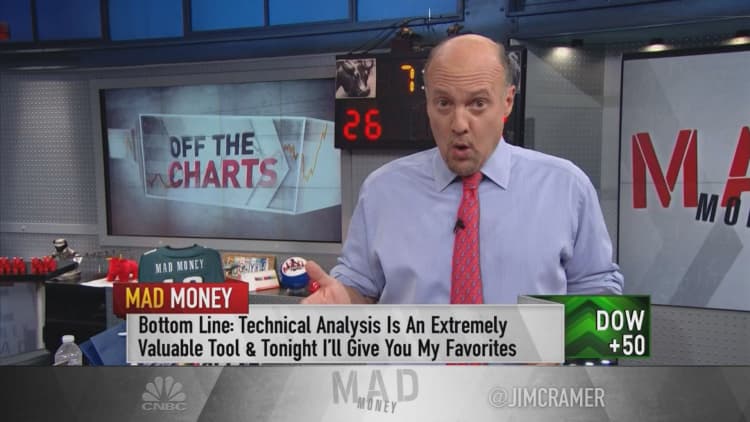
CNBC's Jim Cramer may not be a chartist, but he understands why charts are so important for predicting the market's major moves.
"You must consider them as if they are footprints at the scene of a crime," the "Mad Money" host said. "These footprints trace out what big money managers might be doing with their buying and selling of stocks."
Cramer cares about charts because there's a remarkable, self-fulfilling nature of charting stocks. Some of the best investment ideas can come from chart-inspired brainstorming sessions, he said.
But for Cramer, the best way to produce results is by carefully analyzing both a stock's fundamentals and its technicals for more comprehensive results.
A good technical analysis means being able to find the indicators that will help to determine the overall direction of the market, especially since so many stocks are influenced by S&P 500 stock futures.
Sometimes, technicians start by comparing the chart of an individual company to the chart of an average to determine the legitimacy of a move, a tactic known as confirmation.
For instance, if the Dow Jones Industrial Average hits a new high, historically, it is not sustainable unless the Dow Jones Transportation Average also hits a high, confirming the breakout status of the Dow itself.
If both the industrials and the transports hit new highs, Cramer feels more secure blessing the move as legitimate.
Other indicators that Cramer watches are the banking index, the housing index, the semiconductor index and the ETF that encompasses large retailers.
"I like to see all of these indexes move up in sync before I truly bless a market move," the "Mad Money" host said. "You get all of these indexes rolling higher, and you have to put the maximum amount of chips on the table."
The inverse is also true. If there's a move up without confirmation from a majority of the indexes, then the whole rally could be fake and shouldn't be trusted. Cramer saw this occur right before the 2008 financial crisis when there was no participation from the financials, retail or tech.
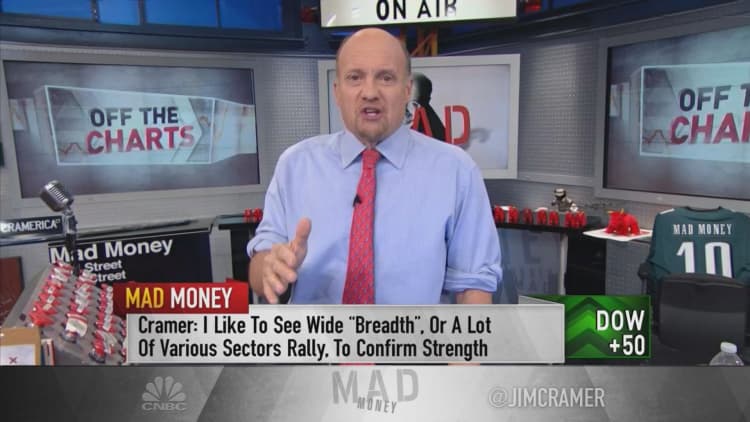
The "Mad Money" host also considers stock advances and declines, which can indicate whether a rally is too concentrated. He likes to see a market with good participation from many different groups.
Additionally, Cramer looks at the new-high-to-new-low ratio, since stocks that make the new-high list are worth watching. It's not easy to get on the list, so any company hitting new highs must be doing exceptionally well, be part of a strong sector and be privy to strong geopolitical forces pushing it higher, he said.
"You may not be a technician, but you need to know what the charts are saying and you need to know how to read the internals to verify a real move or a phony one," Cramer argued.
WATCH: What Cramer looks for in stocks' technical charts

Questions for Cramer?
Call Cramer: 1-800-743-CNBC
Want to take a deep dive into Cramer's world? Hit him up!
Mad Money Twitter - Jim Cramer Twitter - Facebook - Instagram - Vine
Questions, comments, suggestions for the "Mad Money" website? madcap@cnbc.com


