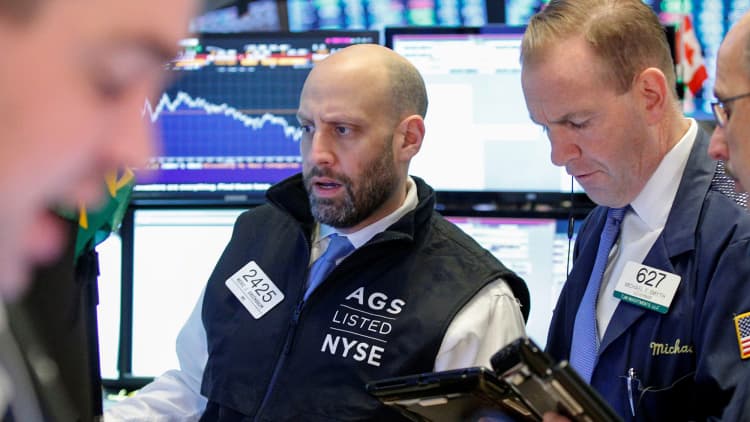
Stocks appear to be trying to trying to find a bottom after the worst sell-off in two years.
The market staged a "turnaround Tuesday" rally after a steep opening drop, but the initial gains did not last and the S&P 500 continues to trade back and forth between positive and negative territory.
"We'd be more inclined to add to our equity exposure today than to subtract from it," said Ed Keon, portfolio manager at QMA. Keon said while the market may still be looking for a floor after a double-digit sell-off. The S&P 500 plunged 4.1 percent Monday in its worst day since August 2011.
"Maybe if you went back and looked at August 2011, you might see a worthwhile parallel. You had a sudden sharp drop, it was volatile for a while and the bull market could resume. I'm not saying today is the all clear signal, and there's no worries. I am saying the worst is probably over. I wouldn't be adding to my equity exposure if I didn't see it as a good time."
Technical analysts were encouraged by the fact that the S&P 500 has held key levels so far Tuesday, and continues to trade around them.
"I think it's going to be carving out a low here. None of this seems unusual. It's getting overdone on the downside, and it's trying to find a support level between the 200-day and 100-day. That should be the start of a short-term process," said Robert Sluymer, technical strategist at Fundstrat Global Advisors.
Sluymer said the 200-day moving average at 2,535, was tested by S&P 500 futures overnight, when they fell to 2,529. The cash tested the 100-day moving average a number of times, at 2,635, as well as the low from Monday at 2,638 and was trading on both sides of those levels.
Sluymer said the market was very oversold, and a metric that looks at advancing issues versus declining issues reached an extreme Monday.
"I know people are wigged out," he said. "The key point is the market overshot on the upside and it's not surprising to see a steep correction and this is probably a range of support."
He said the longer-term cycle should be intact. "Pullbacks to the 200-day moving average are not unusual," said Sluymer.
On the upside, traders are watching the 2,700 level and the 50-day moving average at 2,715.
Some traders were cautious, and said it's possible the effort to set a bottom could fail.
"This kind of zigzagging is very typical of a bottom-forming process," said Art Cashin, director of floor operations at UBS. "You want to see if they try to retest the morning lows, or do they sell down a bit and rally, and set a process of higher lows and higher highs."
In late morning, Cashin, said in a note: "Having failed to retest the opening lows, the next likely pattern becomes an attempt to work up a series of higher highs and higher lows."
WATCH: President Trump praise the stock market's epic rally—before it fell


