


Shares of Amazon plunged for a third-straight trading day on Monday, and it may have opened up the kind discount that investors are looking for, according to the charts.
CNBC's Jim Cramer, citing analysis from chart analyst Caroly Boroden, said the stock is on a positive trend that could carry it back above the $2,000 level in due time. Since reporting a second-quarter profit miss last week, the equity has shed nearly 4.5%, but it has a chance to catapult past its record high, says Boroden, who heads FibonnacciQueen.com
"Boroden says that the larger pattern here is still bullish, pointing to much higher prices down the road," the "Mad Money" host said. "After the stock's recent pullback, she thinks you're getting a rare buying opportunity in Amazon."
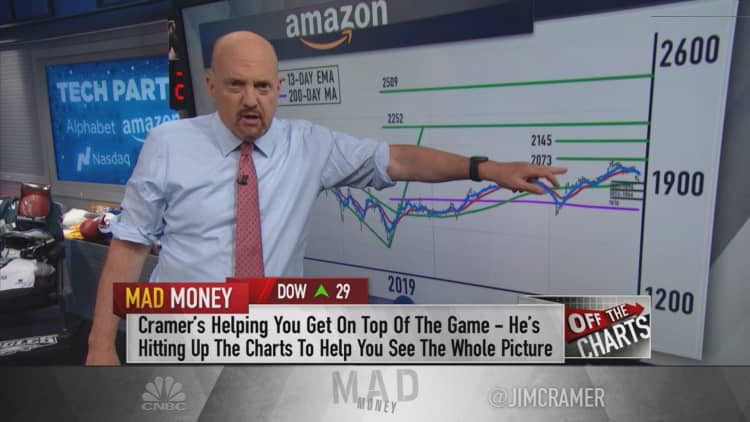
Boroden, a Cramer colleague at RealMoney.com, predicts the stock could be gearing up to rally to about $2,073, a more than 8% upside from Monday's close. In order for that to happen, the stock must hold above a group of support levels in the $1,880 and $1,890 ranges, Cramer explained.
On Monday, shares of Amazon started trading at $1,930, bottomed near $1,890 and recovered some to end the session above $1,912. If the stock falls below the aforementioned levels of support, Boroden says it has additional support to lean on at about $1,860, Cramer said.
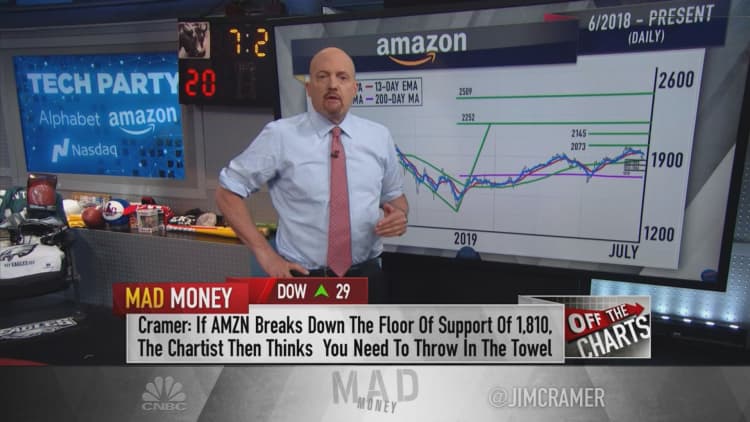
Boroden's long-term price target for Amazon, based on past rallies, is $2,145. In the best case scenario, she thinks the stock could climb as high as $2,509, Cramer said. For that to happen, she says, the stock's five-day exponential moving average has to rise above the 13-day exponential moving average on the same daily chart, the host added.
"That crossover is the Fibonacci Queen's buy trigger because it tells you when a stock has gotten its groove back," Cramer said. "Of course, if Amazon breaks down below Boroden's last floor of support at $1,810, that means she's wrong and she says you got to throw in the towel. I think she's going to be right."
WATCH: Cramer goes off the charts on Amazon, Alphabet and the Nasdaq 100
Disclosure: Cramer's charitable trust owns shares of Alphabet and Amazon.
Questions for Cramer?
Call Cramer: 1-800-743-CNBC
Want to take a deep dive into Cramer's world? Hit him up!
Mad Money Twitter - Jim Cramer Twitter - Facebook - Instagram
Questions, comments, suggestions for the "Mad Money" website? madcap@cnbc.com