If you've been gleaning financial headlines, you may be asking, what is this "inversion of the yield curve" thing and why is it so scary?
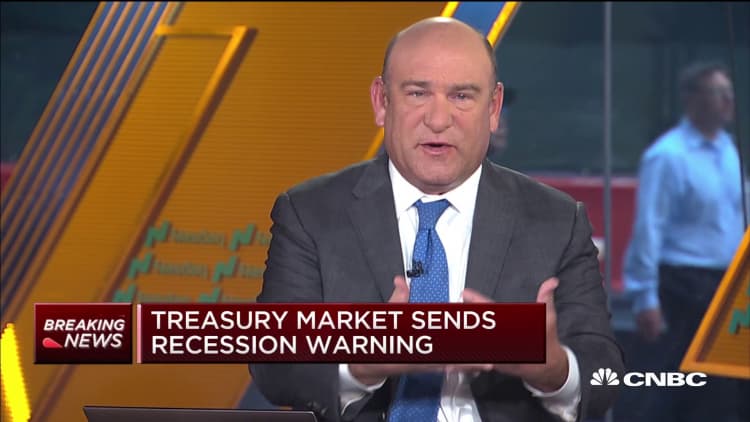
An inverted yield curve marks a point on a chart where short-term investments in U.S. Treasury bonds pay more than long-term ones. When they flip, or invert, it's widely regarded as a bad sign for the economy.
Getting more interest for a short-term than a long-term investment appears to make zero economic sense.

Go to any bank and you will likely get a lower interest rate on a 6-month CD than you would on a 5-year CD. The bank pays you less because you're only giving up your money for six months instead of five years. But imagine if this were inverted and bank paid more for the 6-month than the 5-year CD.
Now think of the U.S. Treasury as a bank. On Wednesday, the Bank of Uncle Sam offered a two-year CD that pays more than its 10-year CD. That is to say, 2-year Treasury bonds were yielding 1.603% while 10-year Treasurys were yielding 1.6%.
Source: CNBC.com
As a consumer, you can see a similar trend at retail banks. The difference between what 6-month vs. 5-year CDs yield, while not inverted, has gotten a lot smaller. The trend is positive for consumers in some ways, with mortgage rates likely to come down further.
One reason inversions happen is because investors are selling stocks and shifting their money to bonds. They've lost confidence in the economy and believe the meager returns that bonds promise might be better than potential losses they could incur by holding stocks into a recession. So demand for bonds goes up and the yields they pay go down.
This widespread loss of confidence explains why inverted yield curves have proceeded every recession since 1956. The last inversion began in December 2005 and heralded the Great Recession, which officially began in December 2007. Then came the 2008 financial crisis. There was also an inversion before the tech bubble burst in 2001.
That's why an inversion is so scary. But does this mean we're having a recession and a big downturn in the stock market? Not necessarily.

First off, it may depend on how long the inversion lasts. A brief inversion could be just an anomaly. In fact, some inversions have not preceded recessions.
The curve may also have inverted because of the Federal Reserve. The market may be saying the Fed has kept the benchmark short-term rate it controls too high and that the central bank should cut rates further because the economy is slowing.
Also, some market observers have said that this time around the yield curve has been distorted by more than $15 trillion worth of foreign bonds that pay negative interest rates — negative interest rates being another trend that seems to make zero economic sense.
Since the 2008 financial crisis, central banks around the globe have never been able to return interest rates to historically normal levels. They lowered interest rates to zero, and even below in some cases, to fight the Great Recession. Interest rates and bond yields have been low all through the recovery and expansion that followed, and they're low still. So no reason to panic, some market observers say, because this is the new normal.
And, if there is a looming recession, it may still be a ways off. A Credit Suisse analysis shows recessions follow inverted yield curves by an average of about 22 months — that would bring us to June 2021 — and that stocks continue to do well for 18 months — through February 2021.
An inverted yield curve, like most other indicators, is not perfect and doesn't mean a recession is imminent. However, between that and the rising amount of negative-yielding debt in the world, strange things are happening with the bond market these days, and that's what's got investors on edge. For consumers, it's reason for caution but not panic.


