


Investors may want to approach the market with caution, despite the three-day sell-off that hit Wall Street, according to analysis from a trusted source of Jim Cramer.
Carley Garner, technical analyst and co-founder of DeCarley Trading, is forecasting that more volatility could be on the horizon over the coming months.
"The recent sell-off could be a sign that this bull's getting long in the tooth," Cramer said Wednesday on CNBC's "Mad Money." "Garner's betting that the S&P 500 can give you one last gasp higher from here, followed by a truly savage sell-off."
The month of September is historically a bumpy month for stocks, and the election season may contribute to more uncertainty in the investment community. While there could be more upside in the S&P 500 after a roughly 2% pullback in the index, Garner sees a bumpy road ahead.
"I don't know if she's right, but that would be pretty par for the course for the historically hideous month of September," Cramer said.
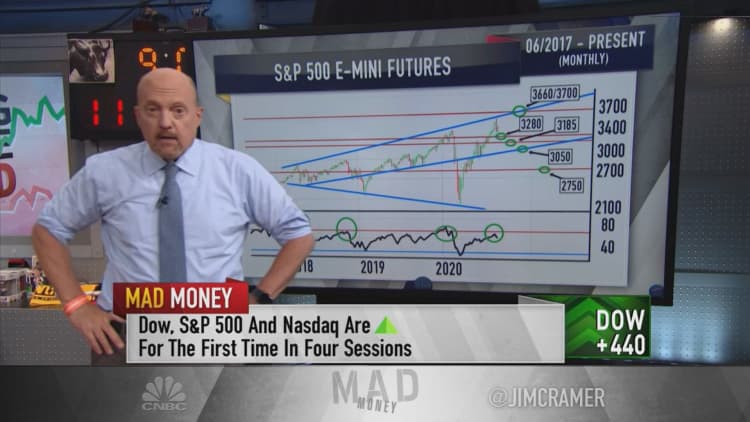
Looking at a monthly chart tracking the S&P 500 and Nasdaq-100, the indexes have rallied hard, "even factoring in their suboptimal performance over the past week," he said.
From the beginning of July, the benchmark had rallied more than 15% to its peak close last Wednesday. The Nasdaq-100, which is composed of about 100 of the largest and most actively traded stocks in the tech-heavy Nasdaq Composite, had rallied 21% in that same time frame.
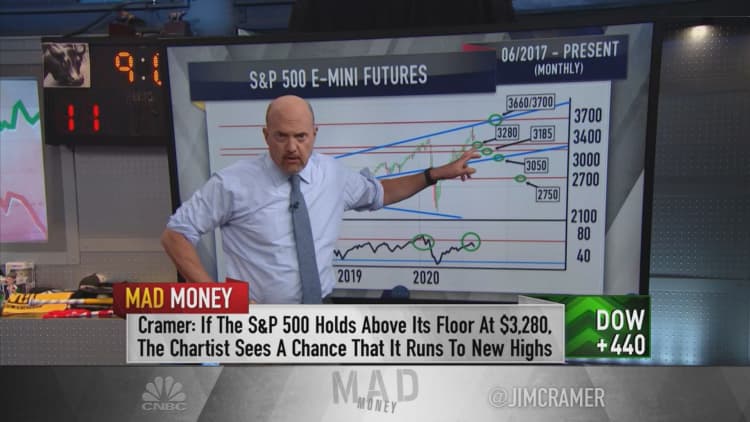
Because of the big gains in the indexes, Garner gets the impression that the market is dominated by momentum, Cramer added. If the S&P 500 can hold above a floor of support near 3,280 — another 3.5% decline from Wednesday's close — the index has the potential to catch up to the Nasdaq-100's gains in the short-run with a ceiling of resistance at 3,660 and another at 3,700, the host said.
Garner's longer-term outlook is a different story. As the Nasdaq 100 made new highs, Garner points out that the relative strength indicator momentum indicator, or RSI, failed to make a new high, leaving the index vulnerable to a correction.
As for the S&P 500, the RSI peaked at 72 when the index peaked in February. The same indicator registered a 67 last week when the index topped out near 3,590 last Wednesday.
That's a sign of froth for Garner.
"When the averages start making new highs, but this crucial momentum indicator can't seem to break out, that's a warning sign," Cramer said. "It makes [Garner] wonder if we're simply pulling forward gains that we'll have to spend months digesting, like we did in 2018 and 2019."
Questions for Cramer?
Call Cramer: 1-800-743-CNBC
Want to take a deep dive into Cramer's world? Hit him up!
Mad Money Twitter - Jim Cramer Twitter - Facebook - Instagram
Questions, comments, suggestions for the "Mad Money" website? madcap@cnbc.com