


CNBC's Jim Cramer on Tuesday advised investors to keep an eye on market volatility, considering that there could be more downside in stocks.
The CBOE Volatility Index, or VIX, is showing signs that current conditions may linger through June, he said.
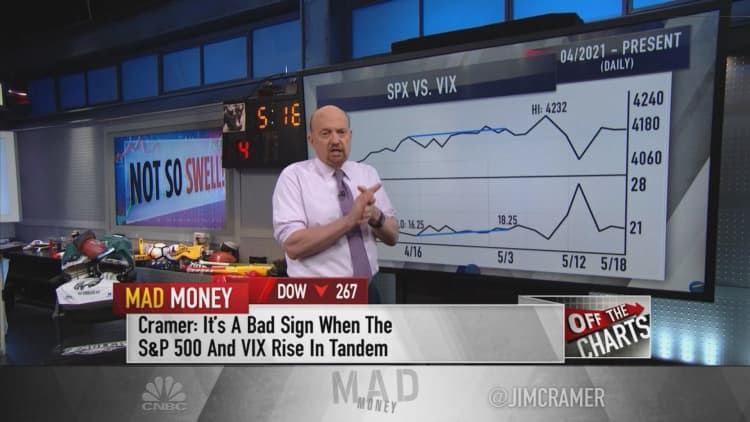
"The charts, as interpreted by Mark Sebastian, suggest that the next month-and-a-half could be a pretty rough time for the stock market," the "Mad Money" host said. "You may think we're out of the woods, but the fear gauge says otherwise."
Sebastian, who founded OptionPit.com and contributes to RealMoney.com, is Cramer's trusted volatility expert. Comparing moves in the S&P 500 and VIX, which is known as the fear gauge, Sebastian plotted a scenario where the market tests lows from last week, Cramer said.
The S&P 500 closed Tuesday at 4,127.83, up almost 2% from a dip last Wednesday.
The S&P and VIX tend to run in opposite directions. After behaving "normally" in the first quarter, when stock prices trended higher while the VIX generally trended lower, the tide appears to be changing, Cramer said.
Since mid-April, the VIX has climbed almost 30% from its lowest close. The S&P 500 is down almost 0.5% in that same period.
"A flat market with a rising VIX is exactly what you see at the beginning of what's known as a volatility swell," Cramer said. "According to Sebastian, this is when the VIX rises for an extended period of time, usually 2 to 6 weeks, and the market has a genuine correction."
Questions for Cramer?
Call Cramer: 1-800-743-CNBC
Want to take a deep dive into Cramer's world? Hit him up!
Mad Money Twitter - Jim Cramer Twitter - Facebook - Instagram
Questions, comments, suggestions for the "Mad Money" website? madcap@cnbc.com