


Investors may want to prepare for a more challenging trading environment next year compared with the gains of 2021, CNBC's Jim Cramer said Tuesday, leaning on technical analysis from DeCarley Trading co-founder Carley Garner.
"The charts, as interpreted by Carley Garner, suggest that the S&P 500 could still have some more upside thanks to that Santa Claus rally that normally gets going at this time of December," the "Mad Money" host said. "But as we head into 2022, she thinks you need to be a lot less complacent because this kind of strength simply won't last forever."
The S&P 500 is up 23.8% year to date and nearly 108% since its pandemic-era closing low of 2,237.40 on March 23, 2020. While it's been an extraordinary rally for Wall Street, Cramer said Garner wants to stress that it's also "been extremely unusual."
"As we get hit with a series of rate hikes next year, you're going to have to steel yourself for uglier action," Cramer said.
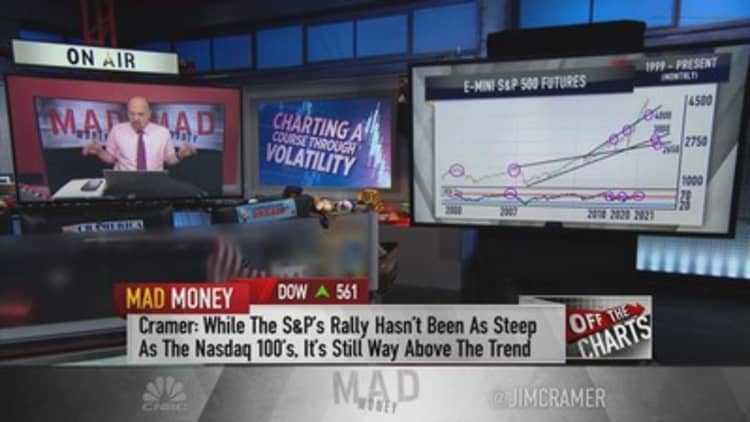
One piece of technical data that Garner is considering is the S&P 500's longer-term monthly chart, according to Cramer. After breaking through the trendline ceiling of resistance roughly a year ago, Cramer said it is now very far above trend.
"Historically, these types of breakouts almost always see a retest of the previously broken trendline," Cramer said. "In other words, she'd expect the S&P to pull back near the trendline, which ...would put it around 4,000. People, that's down almost 14% from here. ... If we get a close below 4,000, she thinks that would pave the way for a much larger correction."
In Garner's view, other worrisome signs include the momentum indicator Relative Strength Index sitting in overbought territory on a monthly chart basis, Cramer said. "When you look at the action over the last 20 years, a reading this high can open the door to some nasty declines," he said.
Cramer said Garner also sees a concerning story in the weekly chart of the E-mini S&P 500 futures when analyzed alongside data from the Commodity Futures Trading Commission's commitments of traders report. That contains the holdings of small traders, large speculators and commercial hedgers.
It currently shows that professional money managers are net-long S&P 500 futures to a degree not seen since October 2018, Cramer said. That was, of course, "right before a huge decline that didn't run its course until Christmas Eve of the same year."
"We saw a similar level of bullishness in early 2018, also right before a sharp correction," Cramer said. "When a trade gets too crowded, you eventually run out of buyers, and the whole thing tends to collapse under its own weight."
Sign up now for the CNBC Investing Club to follow Jim Cramer's every move in the market.
Questions for Cramer?
Call Cramer: 1-800-743-CNBC
Want to take a deep dive into Cramer's world? Hit him up!
Mad Money Twitter - Jim Cramer Twitter - Facebook - Instagram
Questions, comments, suggestions for the "Mad Money" website? madcap@cnbc.com