NASDAQ Uptrend More Reliable Than S&P's: Charts

No Title_22670022

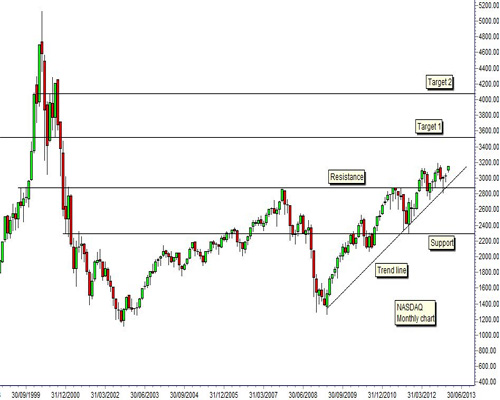
The NASDAQ index is not a replica of the S&P 500 Index. It's correct that the NASDAQ is moving into new six-year highs but it has been doing this for many months. The breakout above 2,900 in February 2012 was the first move to make new six-year highs. The general NASDAQ uptrend continued for most of 2012.

There is a very important difference between the NASDAQ uptrend and the S&P uptrend. The S&P is moving towards 1,550. This is a high point reached in 2000 and again in 2007. It has been a powerful resistance level and it could be a powerful resistance level in 2013.

When the NASDAQ moved above 2,900 in 2012 it broke above the strongest resistance level on the NASDAQ index. To understand why, we need to look at some history. In October 1999 the NASDAQ paused briefly near the 2,900 level and then it moved rapidly upwards. In four months it moved from 2,990 to the peak high of 5,132.

This was a massive 71 percent rise later called the internet or tech bubble. From the high of 5,132 the NASDAQ collapsed to below 2,990 in eight months. It took another two years to reach the turning point low of 1,329 in October 2002 at the bottom of the downtrend.

The key feature of importance is the rapid rise and fall pattern once the NASDAQ passed the 2,900 level. In 2012 this rapid rise was not repeated. The rising trend is more stable and this suggests the NASDAQ trend is more reliable.

The rapid rise and fall in 1999 and 2000 means there aren't any strong resistance or support levels above 2,900. This makes it difficult to set estimated targets for the current rising NASDAQ trend. Targets for the current trend are calculated using a different method.

Between 2010 and 2011 the NASDAQ moved in a narrow trading band. The lower edge of the band was near 2,300. The upper edge was near 2,900. During 2012 the 2,900 level acted as a support level. The next upside target for the NASDAQ is calculated by projecting the width of the trading band upwards above 2,900. This gives a target near 3,500.

This trading band projection method can be applied again to set a new target above 3,500. This is near 4,100. This level is near to some short term consolidation that developed in June 2000. This is a weak consolidation level but it helps to confirm the long term upside NASDAQ target near 4,100.

The steadily rising NASDAQ trend is defined with the up sloping trend line. It continues in a bullish environment with 3,500 as the first upside target.

Daryl Guppy is a trader and author of Trend Trading, The 36 Strategies of the Chinese for Financial Traders –www.guppytraders.com . He is a regular guest on CNBCAsia Squawk Box. He is a speaker at trading conferences in China, Asia, Australia and Europe.

If you would like Daryl to chart a specific stock, commodity or currency, please write to us at ChartingAsia@cnbc.com. We welcome all questions, comments and requests..

CNBC assumes no responsibility for any losses, damages or liability whatsoever suffered or incurred by any person, resulting from or attributable to the use of the information published on this site. User is using this information at his/her sole risk.