Why This Charts Signals Trouble Ahead for Stocks

The S&P may continue to reach all-time highs. But looking beyond that benchmark index, Mark Dow of the Behavior Macro blog sees a reason why the market could sell off.

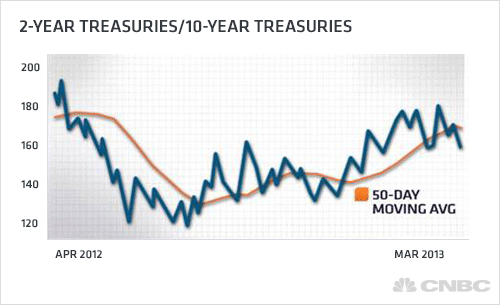
It is simply this: The chart of 2-year Treasurys over 10-year Treasurys has just turned around, and the chart line has fallen below its 50-day moving average.

(Watch: Chart Means Trouble for Stocks: Pro)

Why does that matter?

First, some background. "When the curve gets steepernamely, when the 10-year yields move higher relative to the 2-year yieldsthat means that people are selling bonds and taking risk," Dow said. "And that's been one of the reinforcing trends we've seen since the beginning of the year."

But that has started to change. "Now it's flattening out and beginning to roll over," Dow told FuturesNow. "Seeing this makes me say it's been a really good run, and it's probably time to pare back a little bit."

In other words, if the chart keeps falling, it will indicate that people are reducing risk.

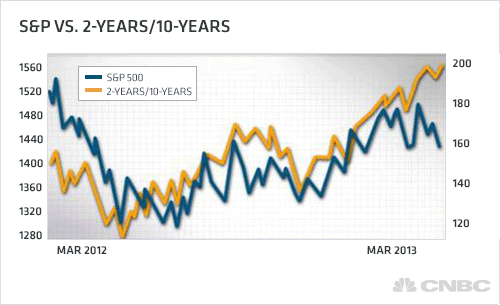
That explains why the 2-year Treasurys/10-year Treasurys chart holds such a strong correlation with the S&P 500.

What's Dow's bottom line?

"Don't get outright short, because you're liable to get run over," he said.

But if you were thinking that now is the time to load up on stocks, this should give you pause.

— By CNBC's Alex Rosenberg

Watch "Futures Now" Tuesdays & Thursdays 1 p.m. ET, exclusively on FuturesNow.CNBC.com!

Like us on Facebook! Facebook.com/CNBCFuturesNow

Follow us on Twitter! @CNBCFuturesNow

Videos

Host Bio & Watch Now

Trader Bios