The Nasdaq leads, and the Dow and S&P may follow. A successful Nasdaq rebound also suggests that Asian markets may also be approaching the limits of the current downtrends.
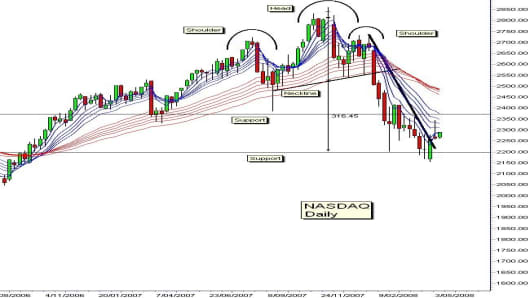
It is a bear season, so we start with the bearish features of the Nasdaq. The weekly chart is dominated by the head and shoulder pattern. The pattern projection sets downside targets at 2,200.
This matches resistance levels in January and August 2006. It was a support level in January 2006. It also provided some consolidation areas in the intervening up and down trends, so there is a high probability the Nasdaq will consolidate near this area in 2008.
Consolidation shows the downtrend has slowed, but it does not reveal a developing uptrend characteristic. We need to apply wider analysis to determine trend features and resistance levels. The interesting bullish feature is the breakout above the trend line. This is the first indication of any bullish strength since the right shoulder collapsed in December 2007.
This rebound faces three significant barriers. They are:
- The resistance level near 2,370 - 2,400. This has acted as resistance in April 2006, and as a support area in March and August 2007. This is not an exact level. Its importance is in the character of resistance. This is a powerful block to any rally continuation developing into an uptrend.
- The upper edge of the short term Guppy Multiple Moving Average (GMMA) is also located near 2,370 - 2,400. This confirms the strength of resistance in this area.
- Any successful move above this level must also be able to break above the long term GMMA near 2,500.
With so many strong resistance features, it suggests there is a low probability that this rally will develop into a genuine new uptrend. It sets the scene for short-term rally trading and a retest of support near 2,200.
This is good news in a bearish market because consolidation is a precursor for a trend change. The consolidation takes the sting out of the trend momentum. Traders will look for a reduction in intraday volatility as the market enters an accumulation phase. They will also use leading indicators such as the Relative Strength Indicator and watch for RSI divergence to develop.
Skilled traders in Asia are looking for mirror pattern in the key indices such as the Straits Times Index, the Hang Seng Index and the Nikkei 225 Average. Smart traders have already observed the saucer, and cup and handle patterns that are developing in individual securities. These reversal patterns don't mean that the worse is over, but they do suggest the bear is starting to retreat.
If you would like Daryl to chart a specific stock, commodity or currency, please write to us at ChartingAsia@cnbc.com. We welcome all questions, comments and requests.
CNBC assumes no responsibility for any losses, damages or liability whatsoever suffered or incurred by any person, resulting from or attributable to the use of the information published on this site. User is using this information at his/her sole risk.