

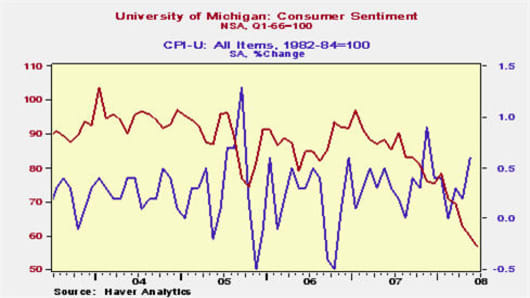
With the CPI numbers coming in higher than expected and consumer sentiment coming in lower than expected, why are the markets up today? The University of Michigan Consumer Sentiment Index (red line in graph below) continued its slide, falling to 56.7 indicating a potential drop in consumer spending. Earlier this morning, the CPI numbers (blue line in graph) rose by .6% for the month due to higher oil prices (the Core CPI, ex-food and energy rose by the expected .2%). Despite these weights on the economy, all major indices are up today.
Many pundits are suggesting the rally is due to a pull back in oil prices. Maybe it's just another Freaky Friday the 13th. Looking back in history, the Dow, S&P and Nasdaq average up nearly 60% of the time on Friday the 13ths. Here are some Friday the 13th stats:
Dow and Friday the 13th
- 190 Friday the 13ths since the Dow began in 1896
- First Friday the 13th for the Dow was on 11/13/1896 - The Dow was down .9% that day
- Last Friday the 13th (prior to today) was on 7/13/2007 -- The Dow gained .3% that day
- The Dow has been up 57.5% of the time on Friday the 13th, with average gains on those up days of .7%
The NASDAQ (since 1971) has had the best Friday the 13th track record, up 61% of the time with an average gain of .8% when up on those days.
Leading the Dow today are Alcoa , Microsoft , Dupont , Intel and IBM
