The Malaysian market has an additional feature. This market is particularly compatible with head and shoulder patterns. They occur often and they display a high level of reliability in this market.
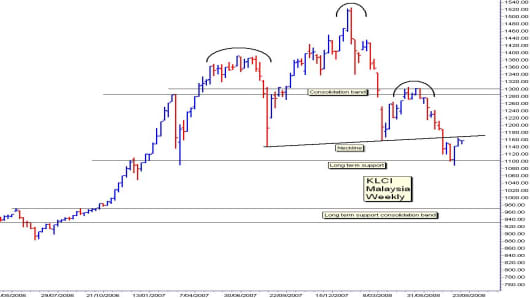
The current pattern starts with the left shoulder developing around June 2007. The head was created in January 2008 while the right shoulder was developed in May 2008. The neckline, or base of the pattern uses the extreme low in August 2007 and the low in March 2008. These extremes in the low, and the spike nature of the high that creates the head suggests we need to apply pattern projection targets with some caution. It doesn’t alter the bearish nature of the pattern message, but it adjusts the way targets are set.
A straight forward application of the pattern target measurement sets a downside target near 780. This target is not an historical support level. Support is located near 800 so this is the higher probability downside target, which is an extreme technical target.
This is not a freefall market. There is a long term support consolidation trading band between 930 and 970. A market collapse has a high probability of pausing in this consolidation area. This is the high probability outcome and traders will look for evidence of trend rebound patterns developing in this region.
Bear attacks are not inescapable so traders also watch for evidence that the bearish pattern will be defeated. The critical trigger levels are support at 1,100 and resistance near 1,180. Long term support is found at 1,100 and this has been the rebound point for the current rally. A successful retest of this level indicates the bear hug could be broken.
The neckline is projected towards the right of the chart. This is a pattern resistance level. A move above this level is further evidence the bear grip is weakening. A move above this level sets the scene for a short term rally towards the consolidation resistance band between 1,280 and 1,300. It is only a sustained move above 1,300 that invalidates the head and shoulder pattern. It is a low probability outcome.
The high probability outcome is a retreat to consolidation support between 930 and 970 followed by the development of a trend rebound pattern. There remains the potential for a sharp temporary fall towards the head and shoulder target near 800.
The sudden temporary falls in March and August 2007 and again in March 2008 show how it is possible for this behavior to develop. This is consistent with the character of the Malaysian market.
If you would like Daryl to chart a specific stock, commodity or currency, please write to us at ChartingAsia@cnbc.com. We welcome all questions, comments and requests.
CNBC assumes no responsibility for any losses, damages or liability whatsoever suffered or incurred by any person, resulting from or attributable to the use of the information published on this site. User is using this information at his/her sole risk.