Dorn: What History Tells Us About Current Market

We have been collaborating with and sending research updates from Dave Harder for the past few months.

Dave and I (independently and using different methodologies) have done research on the Crash of 1987. Our aim was to attempt to study market trajectory in the presence of twice as many advancing issues compared to declining issues (and vice-versa) for 10 consecutive trading days. When there are twice the numbers of the advancing issues over declining issues, it means that there is lot of strength beneath the surface of the market. As far as we can tell this has only happened a few times.

When it has, the markets have gone up every time for quite a while. It happened in early January 1975, at the end of the 1973-1974 bear market and at the end of August 1982 (two weeks after the end of that bad bear.) It happened again in January 1985 and January 1987 right before a 40% rise. Whether it will be a bear market rally or a new bull remains to be seen. We now need to keep an eye on the A/D data from last Friday, today and tomorrow, as it may prove to be one of the clearest and best signals to show that an intermediate low is in place.

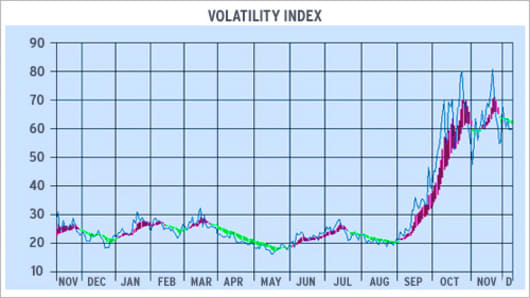
Also, please find below, the chart for the Volatility Index ($VIX). The $VIX is, simplistically, an indicator of fear. In this chart the indicator turns red to indicate that the $VIX has started a downtrend, and green to indicate that it has started an uptrend.

Volatility Chart
CNBC.com
Volatility Chart

As you see, it turned green at the beginning of September and stayed green until November. Markets often make a major low after completing a double bottom. A double bottom suggests that equities have made the switch from weak hands to strong hands. You can see that the $VIX made a perfect double top that coincided with the October 27th and November 20th equity lows. Most equity markets, currencies and commodities have completed a double bottom and the indicator has turned red for the $VIX again for the first time since early November.

This would have enabled an investor to miss most of the bear market decline. The signal given by this indicator is a very positive sign, but—in terms of cycle work—it is our opinion that we are not there yet and need more time. The market will tell us how much more time, but we have some good clues from market history and cycle work. Further confirmation of this signal will be provided when this indicator turns positive for all the market averages for the first time in months.

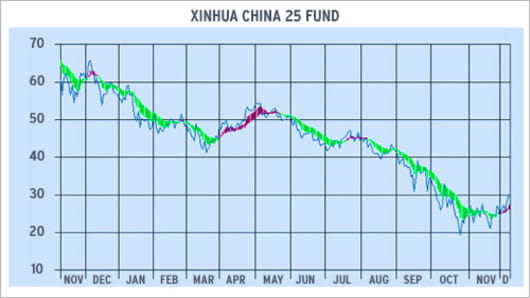
It is also of interest to see the chart of the FXI ( proxy for China). The strongest equity markets are in the US and China, the biggest consumer nation in the world, and the major consumer of resources.. This bodes very well for global economies. Thanks and Good Trading!

Xinhua China 25 Fund
CNBC.com
Xinhua China 25 Fund


What are Other CNBC.com Guest Bloggers Saying ...

___________________________________

Janice Dorn, M.D., Ph.D., is a financial psychiatrist and chief global risk strategist for Ingenieux Wealth Management in Sydney, Australia. She also offer trading consulting and coaching services via her Web site, TheTradingDoctor.com.