The upside target is near $1,250 and is a maximum target level.
An alternative calculation projects the measurement value from the breakout value near $1,130. This gives a lower upside target of $1,225 - a value which has been exceeded.
When the price approaches the target level, the momentum usually declines. The best result is the development of a consolidation pattern which is a foundation for a new trend breakout.
The upper resistance levels for the consolidation pattern is $1,250. The lower level for the consolidation pattern is near $1,225. A breakout above this type of consolidation pattern gives a first target near $1,275.
The recent trend rise has been very fast. This has the features of a fast rally so there is a higher probability the price will fall below the $1,225 level before developing a rebound.
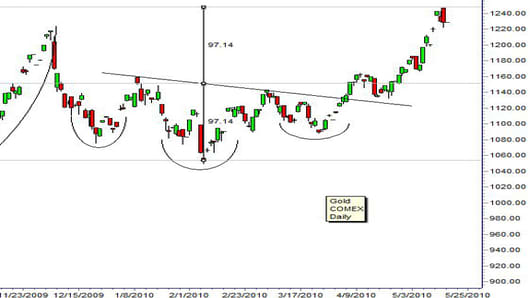
The potential support level for any price retreat is provided by the uptrend line. The current value of this line is near $1,190. A fall and rebound from this level shows a sustainable uptrend. This allows for a steady trend rise above $1,250 and higher.
The pattern of any retreat and rally may allow for the calculation of new upside targets.
A consolidation between $1,225 and $1,250 also allows the price activity to move sideways for another four weeks before price meets the uptrend line.
In this situation traders watch for the uptrend line to act as a support level. This develops into an uptrend continuation with initial upside targets near $1,275.
Daryl Guppy is a trader and author of Trend Trading, The 36 Strategies of the Chinese for Financial Traders –www.guppytraders.comand producer of Gold – Mining the Markets. He is a regular guest on CNBC's Asia Squawk Box. He is a speaker at trading conferences in China, Asia, Australia and Europe.
If you would like Daryl to chart a specific stock, commodity or currency, please write to us at ChartingAsia@cnbc.com. We welcome all questions, comments and requests.
CNBC assumes no responsibility for any losses, damages or liability whatsoever suffered or incurred by any person, resulting from or attributable to the use of the information published on this site. User is using this information at his/her sole risk.