

Global events like heightened Korean tensions and a spreading European debt contagion may have supported the U.S. dollar in recent days, as investors flee risk assets for the safety of the greenback; but the uptrend has already been in place for a few weeks now, ever since the Federal Reserve announced its second round of quantitative easing on November 3.
The reaction is seen as counter intuitive, and, according to technical analysis, shows the reversal from the prolonged downtrend has the potential to develop into a significant trend change.
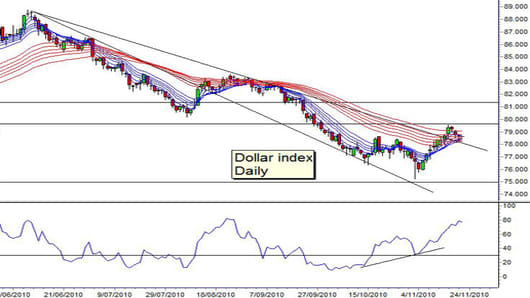
The U.S. dollar index chart is dominated by support and resistance levels and two trend lines. The two downtrend lines start from a single high near 0.89. The lower trend line initially acted as a resistance level, but more recently became a support level. The higher trend line, meanwhile, has pretty much held up as a resistance level. The rally breakout to 0.795 has moved above the upper trend lines and is now using the trend line as a support level.
This combination of multiple trend lines and the reversal of their support and resistance function is part of a fan pattern. The fan pattern is a long-term trend reversal behavior. This supports the long-term rise in the U.S. dollar. The target levels for a rise are determined by the horizontal support and resistance levels.
The most important of these levels are located near 0.795 and 0.815. The breakout above the downtrend line stopped at the resistance level near 0.795. A rebound and break above 0.795 is very bullish and sets an upside target near 0.815. The success of the resistance breakout is the main focus for the market in coming weeks.
Two other indicators support the potential for an extended trend change. The Guppy Multiple Moving Averages indicator tracks the behavior of traders and investors. Investor selling is shown by the group of red GMMA averages. Trend changes develop after a series of increasingly successful tests of investor sentiment by traders. The current rally shows the short term GMMA averages have almost penetrated above the upper edge of the long term GMMA averages. This is a typical relationship in a developing trend change. Confirmation comes when the long term GMMA averages compress and turn upwards and the short term GMMA averages move above the long term group.
The second indicator of extended trend change is the divergence in the Relative Strength Index indicator. This is not an exact divergence technically, but it does send a very strong signal. The direction of the trend between the recent lows of the dollar index is downwards, while the corresponding direction of the trend between the lows in the RSI indicator is upwards. This creates an RSI divergence pattern. This is a reliable trend reversal signal. It is not a good indictor of reveral trends when used alone, but when combined with the other trend reversal signals, it confirms there is a high probability the dollar rally will extend into a trend change.
The U.S. dollar index may continue to slide down the upper trend line, using it as a support level, prior to a rebound and retest of resistance near 0.795. The chart indicators suggests there is a higher probability of a sustained breakout above 0.795.
Daryl Guppy is a trader and author of Trend Trading, The 36 Strategies of the Chinese for Financial Traders –www.guppytraders.com. He is a regular guest on CNBC's Asia Squawk Box. He is a speaker at trading conferences in China, Asia, Australia and Europe.
If you would like Daryl to chart a specific stock, commodity or currency, please write to us at ChartingAsia@cnbc.com. We welcome all questions, comments and requests.
CNBC assumes no responsibility for any losses, damages or liability whatsoever suffered or incurred by any person, resulting from or attributable to the use of the information published on this site. User is using this information at his/her sole risk.
