

The Japanese earthquake, tsunami and nuclear plant problems have inflicted a massive human toll. The effects will continue in the Japanese market for months and years to come. At the time of the Kobe earthquake in 1995 the Nikkei was in a much strong position than it was in 2011, prior to the current earthquake.
1995 was the start of a global bull run that carried markets to the frenzy of 2001 highs, although the Nikkei limped along. 2011, on the other hand, has global markets emerging slowly from the global financial crisis.
The Japanese market is very much weaker, with a very slow recovery from the 2009 lows. It is against these two backgrounds that we apply a technical analysis of the Nikkei. The first part looks at the potential downside targets.
That the market will fall, and fall rapidly is a given. The key question is how far the market may fall before it finds support. The reaction to the Kobe earthquake provides some clues.
The second question is to examine the potential behaviour in a recovery. Again, the Kobe earthquake, although much smaller, provides some guidance.
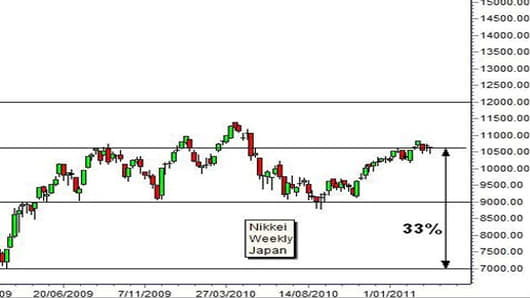
We start with the weekly Nikkei chart. The market created a double bottom low in 2008 and 2009 near the 7,000 level. This double bottom low was separated by a rally and retreat. This is a classic “W” pattern recovery. The height of the rally is measured as used to calculate the upside target. The rally reached 9,000 and provided a calculated upside target near 11,000. This was achieved, and it is slightly above the historical resistance level near 10,500.
CNBC.com
The market was testing the 10,500 resistance level. The reaction to the earthquake and tsunami starts from this level. The immediate downside support target is 9,000. An event of this nature over-rides the consolidation support features inside this trading band so the market will drop rapidly to the 9,000 level. There is likely to be limited support at this level, so investors and traders must be prepared for the potential to fall below this level.
There is limited consolidation activity between the support lows at 7,000 and the support/resistance level near 9,000. The market spent a limited time in this area between 2008 and 2009 so there is little evidence of good consolidation in this area. This increases the probability of a rapid fall towards 7,000.
Support at 7,000 has a significant technical problem. It is defined by two extreme lows. Historically this is a support level, but it has not been tested multiple times. It does not have an established history as a support level. It is below the June 2003 lows. Despite this lack of historical support traders will look for consolidation around this level. A fall to this level represents a 33% drop.
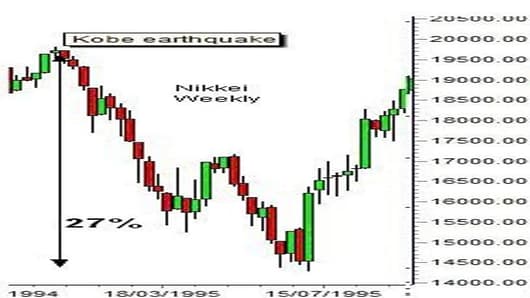
The reaction to the Kobe earthquake provides some guidance. The fall in response to this event was 27% from near 20,000 to near 14,500. The market fell quickly below support levels, and then developed a temporary rally prior to testing the previous downtrend low near 14,500. The single point in September 1992 provided a support target for the 1995 Kobe fall. The same may reoccur with the current market retreat.
The Kobe experience shows the market can make a rapid and sustained rebound, although it takes more than six months for the market to recover. The process includes a false rally followed by a confirmed break above the downtrend line. But remember, these developments occurred in the context of a much healthier global market.
There is no reliable method to anticipate how markets will react to events such as the earthquake and tsunami. However previous levels of support, and the behaviour of the market in similar events provides a framework for analysis. As events unfold they can be compared to this framework and help investors to make better decisions.
(We encourage all traders to take a days profits and donate them to the recovery efforts.)
Daryl Guppy is a trader and author of Trend Trading, The 36 Strategies of the Chinese for Financial Traders –www.guppytraders.com. He is a regular guest on CNBC's Asia Squawk Box. He is a speaker at trading conferences in China, Asia, Australia and Europe.
If you would like Daryl to chart a specific stock, commodity or currency, please write to us at ChartingAsia@cnbc.com. We welcome all questions, comments and requests.
CNBC assumes no responsibility for any losses, damages or liability whatsoever suffered or incurred by any person, resulting from or attributable to the use of the information published on this site. User is using this information at his/her sole risk.
