

The Euro/Dollar achieved the $1.49 target we set on CNBCAsia Squawk Box in March. There are three chart characteristics to the EuroDollar behaviour on the weekly chart.
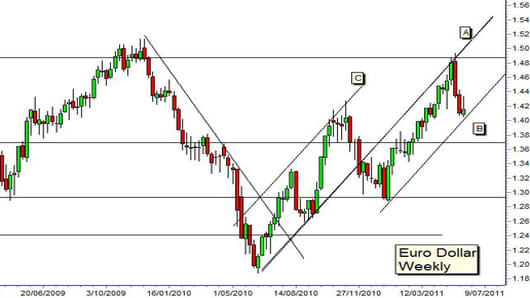
The first is the role of the up sloping trend line A. This trend line originally acted as a support level until it was broken in November 2010. The line was then projected forward and it changed its character to become a resistance level. This is not a perfect placement of the line, but it capturers the up trending behaviour in 2011. The reaction away from the $1.49 level confirms trend line A as a resistance line.
The second feature is the development of a lower parallel trend line B that defines a trend channel. This is a projected line that start from the low of January 2011.
There is a good probability the Euro/Dollar will continue to use this trend line B as a support level and develop continued upward pressure within the confines of this trading channel.
The Euro/Dollar has moved in a similar trading channel starting from June 2010 and ending November 2010. This is shown with trend line C. The channel behaviour of the Euro/Dollar is a strong characteristic of this chart. A break below the lower trend line B sees a test of historical support and the potential development of another lower and parallel trend line.
The third feature is the role of strong historical support and resistance levels. The first of these is near $1.37. The strongest of these is near $1.29. A fall below trend line B has support near $1.37 but a fall is most likely to find support lower around $1.29. A fall below trend line B is bearish.
The Euro/Dollar is at a significant point with the potential to prove the placement of trend line B and thus signal a continuation of the up trend. Failure of support at trend line B signals a change in the trend and a move towards $1.29.
The behaviour of the Euro/Dollar is also a function of the behaviour of the US Dollar index. The rebound from $0.73 and $0.76 is not a break in the downtrend in the Dollar Index.
The downtrend line starts from the high near $0.89 in June 2001 and uses the cluster of highs near $0.815 in January 2011. This downtrend line is projected forward and forms a resistance barrier with a current value near $0.765. The US Dollar index is reacting away from the downtrend line.
This retreat has initial support near $0.745 and lower support near $0.715. The downtrend pressure with the US Dollar index remains strong and this suggests there is a higher probability that the Euro/Dollar will rebound from trend line B and continue with the up trending trading channel.
Daryl Guppy is a trader and author of Trend Trading, The 36 Strategies of the Chinese for Financial Traders –www.guppytraders.com. He is a regular guest on CNBC's Asia Squawk Box. He is a speaker at trading conferences in China, Asia, Australia and Europe.
If you would like Daryl to chart a specific stock, commodity or currency, please write to us at ChartingAsia@cnbc.com. We welcome all questions, comments and requests.
CNBC assumes no responsibility for any losses, damages or liability whatsoever suffered or incurred by any person, resulting from or attributable to the use of the information published on this site. User is using this information at his/her sole risk.
