

Bulls and bears are fighting it out over the 1140 level on the S&P 500 and, if bears win, stocks could go tumbling to 1100 or even much lower.

Darrell Gulin | Stone | Getty Images
That support level has become a line in the sand, and if the market closes below it, stocks could see a new swoon, back down to the 1101 low of early August and possibly below, some technicians say. The S&P 500was flirting with that level on Monday, trading below it before recovering ground to close 8 points higher at 1162 after a late-day rally.
"Friday, the big down day, took us right to the bottom end of this rising channel we're in, so this would be an area where we think support would develop" said Paul LaRosa, chief market technician at Maxim Group. "Today's further drop brings us below that range, which is a concern. If we close below that area, which is 10,929 on the (Dow Jones Industrial Average) and 1140 on the (S&P 500), we're going to be in a position to challenge the lows we hit in August."
The Dow industrialswas trading well below the 10,929 level Monday, but shook off losses and closed higher at 11,061, up 68 points.
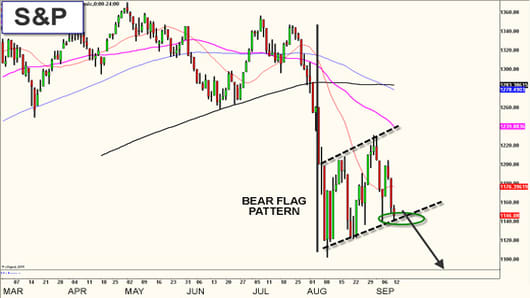
Scott Redler of T3Live.com said the pattern he's been watching in the S&P 500 is known as a "bear flag," and the longer it goes on, the more likely it is the market will retest its lows and break below them. Several weeks ago, he saw a 50 percent chance that the market had hit its lows for the year. Now he believes the likelihood of having set the 2011 lows is just around 20 percent.
"A bear flag is a continuation pattern that develops when the market's trying to figure out if it has correctedenough. What you can see is a defined range between 1101 and 1235," he said.
For the Dow industrial average, he said the 1101 S&P 500 level corresponds to just 10,600.
"There were some outlier days, but really the flag's been created over the last six weeks, in the range between 1100 and 1200," said Redler of the S&P.
"Then the next fight is for 1101. We've been spending six or seven weeks trying to figure out if the market is going to hold this range...at this point it feels like it's pointing more to the downside. The new measured move for this pattern takes you down to 1020, to 1050," if 1101 is breached, he said.
Jordan Kotick, Barclays Capital global head of technical strategy, said there are other factors that are more important for stock market direction than 1140.
"As long as people are watching (the 1140 level), it's going to matter, but it will be trumped by Europe," said Kotick, adding that he's is watching the European stock market, bonds, and interest rate spreads. "As long as they show vulnerability, don't obsess about magic levels in the S&P," he said.
Kotick said September is the most volatile month for the VIX (CBOE Volatility index) and the market is just midway through it.
Questions? Comments? Email us at marketinsider@cnbc.com
