

The Euro Stoxx 50 provides a proxy to the slow moving crisis that is consuming Europe. The result of the weekend Greek elections were a relief and this was reflected in substantial rebounds in most indexes.
This is a reflection of short term pressures rather than long term solutions. It creates a failed relief rally and the context of this is shown on the Euro Stoxx 50 chart.
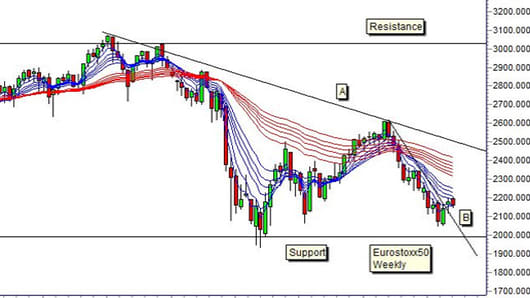
In a broader European context the prospect of a Spanish flu helps set the bearish environment. In 1919 the Spanish flu wiped out millions of people and in 2012 the new version of the Spanish flu has the capacity to wipe out billions of dollars. The weekly Euro Stoxx 50 chart has four significant chart analysis features. The first feature is the very broad sideways trading band. The lower edge of support is near 1,990.
This support level was exceeded in 2008 and again in 2011 so the location of this support level is approximate. Generally traders can look for a rebound from near this 1,990 level but it is not an exact level that can be relied upon. And that’s only part of the bearish story.
Resistance is near 3,040. It’s well defined with multiple tests. A run from 1,990 to 3,040 delivers a 52 percent return and this sounds attractive. However, the strength of the resistance near 3,040 puts a practical cap on these returns. It simply means that this index cannot be traded as a long term directional trade.
The second dominant charting feature is downtrend line A. This trend line uses the peak of the 2011 rally as the second location point for the trend line. The line A has not been tested for a third time but its current value near 2,480 suggests an immediate limit to any rebound rally development. A new retreat away from this trend line confirms the bearish bias inside this broad sideways trading band. This would increase the probability of support failure near 1,990.
The third feature is trend line B and this is the breakout that appears to give some hope. This breakout is a continuation of the relief rally leading up to and following the Greek elections. It signals a short rally rather than a change in the long term trend direction.
It’s the fourth charting feature that confirms the higher probability of a short term relief rally. This is the location and character of the Guppy Multiple Moving Average indicator. The long term group of averages shown in red, track the behavior of investors.
The wide separation in this group suggests the current downtrend is well supported – or well sold. As the rally develops investors will sell into the rally. This imposes lower limits for the rally, around 2,300. The relief rally has a significant resistance area to overcome before it can reach the value of trend line A.
This combination of chart features paint a bearish picture. The brush stokes to complete the picture may be painted with a Spanish flu. Trade the rally but be ready to stop out and reverse to short positions.
Daryl Guppy is a trader and author of Trend Trading, The 36 Strategies of the Chinese for Financial Traders –www.guppytraders.com. He is a regular guest on CNBC's Asia Squawk Box. He is a speaker at trading conferences in China, Asia, Australia and Europe.
If you would like Daryl to chart a specific stock, commodity or currency, please write to us at ChartingAsia@cnbc.com. We welcome all questions, comments and requests.
CNBC assumes no responsibility for any losses, damages or liability whatsoever suffered or incurred by any person, resulting from or attributable to the use of the information published on this site. User is using this information at his/her sole risk.
