


A lot has happened since Feb. 2, 1998. That was when the S&P 500 first closed above the psychologically significant 1,000 level. More than 16 years later, the S&P is now flirting with a close at or above the 2,000 mark.
During that span, the investing world has dealt with everything from the dot-com bust, to the tragedy of the Sept. 11 terrorist attacks, to the worst financial crisis since the Great Depression.
The stock market has been able to bounce back from every negative headline, and set fresh record highs. But, some stocks have fared better than others.
The resident number crunchers at CNBC took a look at the current members of the large-cap S&P 500 index and sorted the list by percent change since Feb. 2, 1998. Many of the stocks on the list weren't part of the index back in 1998, but have risen to become some of the biggest companies in America.
Read MoreS&P signals further gains amid warnings
Among the best performers are companies like Apple, which comes in at No. 4 on the list of top performers. On a split-adjusted basis, shares were trading at around 63 cents when the S&P 500 first crossed the 1,000 mark. After a vigorous and transformational set of product debuts and launches, the tech giant is now trading at record prices, over $101 per share.
Read More We're 5 years into a 20-year bull stock market: Pro
That's good enough for a near 16,000 percent return during that time frame. Apple is the most valuable company in the world, worth $609 billion.
No. 3 on the list is large-cap biotech company Celgene, which is focused on treatments for cancer and other serious diseases. Back in early 1998, shares were trading at a split-adjusted 35 cents per share. Today, Celgene is trading at more than $93 per share, resulting in a gain of over 26,600 percent and yielding a market cap of $75 billion.
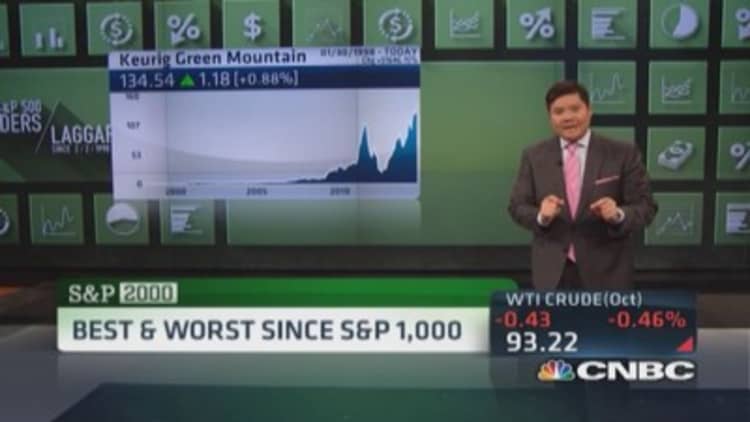
The top of the list belongs to a couple of consumer staples companies, both of whom are in the nonalcoholic beverage business. The runner-up on our list of top performers is Keurig Green Mountain. The maker of single serve coffee and tea products was a 28-cent stock for S&P 1K.
Today, it's more than $132 and worth $22 billion, good enough for a 47,600 percent gain. Of course, more recently, a large investment from the likes of Coca-Cola has helped juice that performance figure.
Read More Why S&P 2,000 milestone has Art Cashin unimpressed
And that brings us to the best-performing stock in the current S&P 500 since the index first crossed 1K. That title belongs to a company formerly known as the Hansen Beverage Co. Back then, it was known for natural soda and juice products. Then, it made serious inroads into the world of energy drinks.
In 2012, the company changed its name to Monster Beverage. The stock went from being worth 10 cents a share on Feb. 2, 1998 to being worth nearly $87 today. That makes it worth more than $14 billion and produced a gain of nearly 83,500 percent. It too was the recipient of a recent, larger scale investment from Coca-Cola.
The top 20 best-performing current S&P 500 members, measured since S&P 1K are below. It may be fair to say that time, patience and some prudent risk-taking has yielded stellar investment results, and now has many wondering what could be the next Monster Beverage or Apple.
Top 20 best-performing current S&P 500 members
| Click to edit | S&P 500 Member | Last | Close on 2/2/1998 | %Chg from S&P 1K | Sector |
|---|---|---|---|---|---|
| MNST | Monster Beverage Corporation | 86.52 | 0.1 | 83481.58 | Consumer Staples |
| GMCR | Keurig Green Mountain, Inc. | 132.6 | 0.28 | 47636 | Consumer Staples |
| CELG | Celgene Corporation | 93.34 | 0.35 | 26648.18 | Health Care |
| AAPL | Apple Inc. | 101.56 | 0.63 | 15977.36 | Information Technology |
| GILD | Gilead Sciences, Inc. | 106.53 | 1.21 | 8697.4 | Health Care |
| TSCO | Tractor Supply Company | 64.93 | 0.86 | 7455.49 | Consumer Discretionary |
| ALXN | Alexion Pharmaceuticals, Inc. | 170.3 | 3.16 | 5295.64 | Health Care |
| BIIB | Biogen Idec Inc. | 344.09 | 7.19 | 4687.34 | Health Care |
| REGN | Regeneron Pharmaceuticals, Inc. | 348.62 | 7.38 | 4627.05 | Health Care |
| ESRX | Express Scripts Holding Company | 75.29 | 1.95 | 3754.85 | Health Care |
| SRCL | Stericycle, Inc. | 119.24 | 3.59 | 3217.98 | Industrials |
| SWN | Southwestern Energy Company | 40.15 | 1.37 | 2836.68 | Energy |
| ORLY | O'Reilly Automotive, Inc. | 155.91 | 6.44 | 2321.9 | Consumer Discretionary |
| EOG | EOG Resources, Inc. | 107.09 | 4.84 | 2110.89 | Energy |
| QCOM | QUALCOMM Incorporated | 76.83 | 3.52 | 2085.38 | Information Technology |
| FOSL | Fossil Group, Inc. | 102.52 | 4.77 | 2051.33 | Consumer Discretionary |
| LH | Laboratory Corp of America Holdings | 106.92 | 5 | 2038.4 | Health Care |
| CERN | Cerner Corporation | 56.71 | 2.7 | 1997.94 | Health Care |
| COG | Cabot Oil & Gas Corporation | 33.49 | 1.65 | 1934.84 | Energy |
| AZO | AutoZone, Inc. | 538.21 | 28 | 1822.18 | Consumer Discretionary |
Source: Source: CNBC Analytics
As for the worst-performing stocks in the S&P 500 during that time frame, they are listed here as well. Seven of the bottom 10 worst-performing stocks are in the financial sector. Many banks have yet to come close to getting back to trading levels from before the financial crisis.
Regions Financial went from being a $33 stock in early 1998 to being a $10 stock today, meaning it's lost nearly 70 percent of its value.
Banking giant Citigroup used to be a $243 stock, if you adjust for split activity. Today, it's worth $52, giving it a 79 percent decline.
And the single worst-performing stock in the S&P 500 since Feb. 2, 1998 is insurance company AIG.
It has performed very well over the last couple of years after emerging from one of the largest government bailouts in corporate history. But, it's still gone from being a $670 stock to being a $56 stock, losing more than 90 percent of its value. All of the bottom 10 performers are in the table below.
Bottom 10 performers
| Click to edit | S&P 500 Member | Last | Close on 2/2/1998 | %Chg from S&P 1K | Sector |
|---|---|---|---|---|---|
| AIG | American International Group, Inc. | 55.89 | 668.37 | -91.64 | Financials |
| C | Citigroup Inc. | 51.86 | 243.08 | -78.67 | Financials |
| RF | Regions Financial Corporation | 10.2 | 32.8 | -68.91 | Financials |
| XRX | Xerox Corporation | 13.68 | 42.13 | -67.53 | Information Technology |
| HBAN | Huntington Bancshares Incorporated | 9.88 | 26.2 | -62.29 | Financials |
| ETFC | E*TRADE Financial Corporation | 22.65 | 59.53 | -61.95 | Financials |
| GT | Goodyear Tire & Rubber Company | 25.26 | 63.38 | -60.14 | Consumer Discretionary |
| KEY | KeyCorp | 13.72 | 33.09 | -58.54 | Financials |
| CA | CA, Inc. | 28.27 | 53.63 | -47.29 | Information Technology |
| BAC | Bank of America Corporation | 16.38 | 30.72 | -46.68 | Financials |
Source: Source: CNBC Analytics
—By CNBC's Dominic Chu. Follow him on Twitter @thedomino.