


With the rapid decline in oil prices recently, Jim Cramer thinks that nothing seems more important to the near-term direction of the stock market than crude.
Black gold broke down again on Friday, stumbling all the way down to $57.81, its lowest close in more than 5 years. In order to get a grasp on what is happening, we need to get an idea on where oil is headed.
Last week, the "Mad Money" host consulted Carolyn Boroden, a technician who runs the FibonacciQueen.com website and is a colleague of Cramer's at RealMoney.com. She used a Fibonacci analysis to predict where oil's floor of resistance will be.
To recap, the Fibonacci analysis is based on the famed medieval mathematician, Leonardo Bonacci who went by the nickname of Fibonacci. He found that a key series of ratios tend to repeat themselves over and over again in nature. It has been used to even predict the shape of flowers and snail shells, and can also be used to predict key levels in the stock market.
Last week, Boroden was bearish on oil. She saw that oil had a floor of support around $64, and then if it didn't pass a few tests than it would be in for a big drop.
Sure enough, on Monday the price of oil broke down from $64 and has been on a slippery slope ever since. Looking at the weekly chart, she sees that the next floor of support is between $50.46 and $55.67, where she thinks oil could bounce.
The question now remains, when will oil bounce? Good thing there's a Fibonacci analysis for that, too!
Oil bounce? Only temporary
Before investors get really excited, Cramer wants to clarify that any bounce is bound to be short-lived. However, oil is predicted to hit an intermediate low sometime this month.
Boroden saw that cycles tend to cluster around the week ending the 12th and the week ending next Friday, the 19th. That means we should be ready for a temporary change in trend next week.
Specifically, the timing cycles point out that oil's short term bottom will occur between the 11th and 12th, and 16th and 18th. One of those cycles was cleared when we hit a new bottom on Friday the 12th, so the next one is nearby.
Boroden predicts that this temporary bounce will have a ceiling of resistance at $69.70.
"Oil's last bounce was a total five steps forward, ten steps back phenomenon, and it's very possible that any future bounce will be similarly short-lived," Cramer added.
What will be needed for oil to gain traction, according to Boroden?
She stated that the price of oil must move up more than $6.13, which would be the largest rally since the downturn began. Additionally, she would like to see a pattern of higher highs and higher lows. Traditionally that is a bullish sign.
The ultimate verdict? Oil is headed lower and will have to make leaps and bounds before the charts turn positive. Sorry, folks.
----------------------------------------------------------
Read more from Mad Money with Jim Cramer
Cramer Remix: This stock is on a major turnaround
Cramer: 6 signs that the consumer glow trumps oil low
Cramer exclusive: Arista CEO fires back at Cisco
----------------------------------------------------------
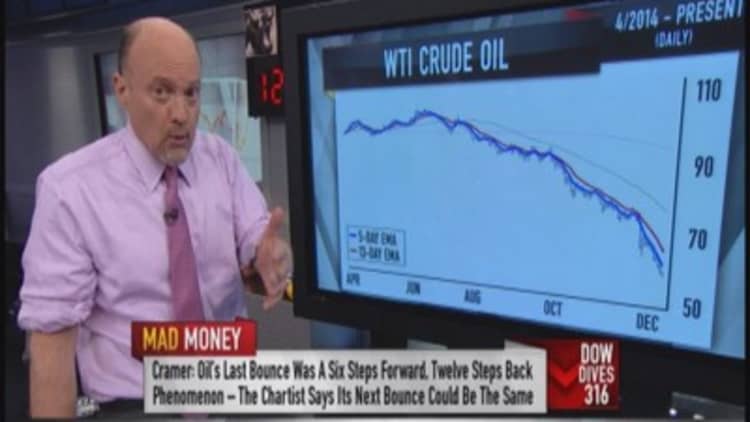
Carolyn Boroden's chart work suggests that oil could be due for a bounce next week, but it will be short-lived. In her perspective, the next stop on the downtown train of oil will be $50-52.
"I think it's very likely that could be our next stop, although it might not be the last station on the way down," Cramer said.
Questions for Cramer?
Call Cramer: 1-800-743-CNBC
Want to take a deep dive into Cramer's world? Hit him up!
Mad Money Twitter - Jim Cramer Twitter - Facebook - Instagram - Vine
Questions, comments, suggestions for the "Mad Money" website? madcap@cnbc.com