


U.S. stocks closed deep in the red on Friday as global growth concerns accelerated selling pressure to push the Dow and Nasdaq into correction territory. (Tweet This)
The major averages had their biggest trade volume day of the year and posted their worst week in four years.
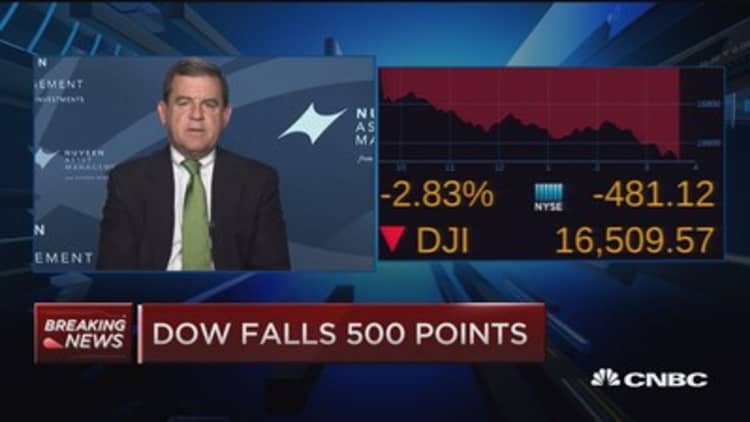
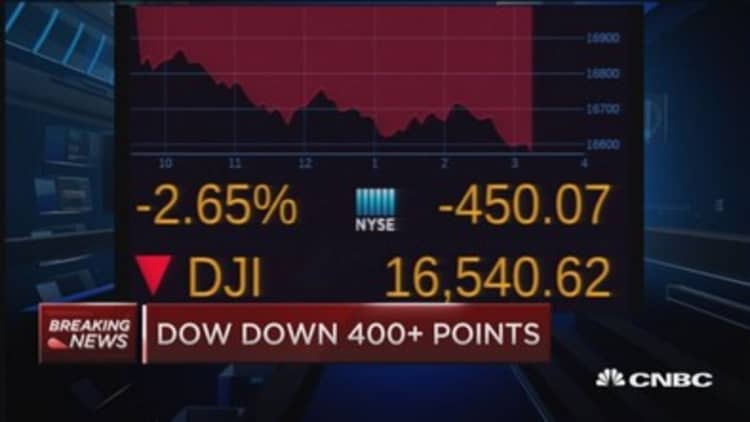
The Dow Jones industrial average closed at session lows, off nearly 531 points and in correction territory for the first time since 2011 as all blue chips declined. The last time the index closed more than 500 points lower was on Aug. 10, 2011. In the last five years, the index has only had four instances with closing losses of more than 400 points.
"For investors the momentum and the drive of the market is now lower (than) it used to be because there's no place to hide," said Lance Roberts, general partner at STA Wealth Management. "Every time we hit the major technical points we kept selling."
"What is important is the price action of the market has done something we haven't seen since the last bull market peak," Roberts said. "There is something going on internally in the market. That illness that has been building up in the market."
A trader also noted that investors stopped looking at technicals and were plowing through them.
"It's an expiration day and it looks like they're to have for sale on the close maybe as much as a billion dollars," said Art Cashin, director of floor trading for UBS.
The Nasdaq Composite lost 3.5 percent, also closing in correction territory and joining the other major averages in negative territory for the year.
Apple declined 6 percent, in bear market territory, and the iShares Nasdaq Biotechnology ETF (IBB) plunged 3.1 percent.
"Right now there is a feeling of fear in the marketplace and all news is interpreted negatively and it's interpreted indiscriminately," said Tom Digenan, head of U.S. equities as UBS Global Asset Management.
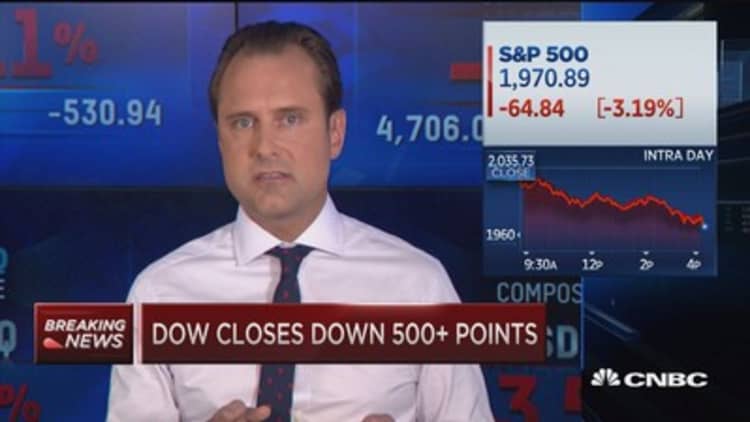
The S&P 500 fell through a support level of 1,980 to end at 1,970, off 7.6 percent from its 52-week high. The index is off about 4.3 percent for the year so far. Information technology and energy led all 10 sectors lower on the day. Energy was the worst decliner for the week, with no sectors posting weekly gains.
About 70 percent of the S&P 500 is in correction or worse, with 31 percent in a bear market and 39 percent in correction territory.
"It's more of the same," said Peter Boockvar, chief market analyst at The Lindsey Group. "From a technical perspective we broke" 2,040 on the S&P 500, the lower end of the trading range.
The Russell 2000 fell into correction territory in the open and failed attempts to stay out of it.
Read MoreCould Russell correction signal more losses ahead?
Earlier, the averages briefly attempted to halve losses in mid-morning trade.
"I think uncertainty about China (and) general negativity is weighing on the market. There's a lack of positive economic news to motivate buyers," said David Kelly, chief global strategist at JPMorgan Funds. He noted "there's nothing particularly negative in the U.S. economic outlook."
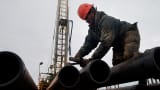
Oil reversed Thursday's late gains to briefly fall below $40 a barrel to $39.86 for the first time since March 2009.
Crude oil futures for October delivery settled down 87 cents, or 2.11 percent, at $40.45 a barrel on the New York Mercantile Exchange. Gold futures for December delivery settled up $6.40 at $1,159.60 an ounce.
"Lower oil prices should benefit the U.S. but whenever they collapse like that that brings back bad memories of what's happening to the global economy," said Ben Pace, chief investment officer at HPM Partners.

"Earnings season has kind of wound down so the Chinese macro story takes on a bit more of importance than it should," said David Lafferty, chief market strategist at Natixis Global Asset Management.
"We've probably had a bit of a healthy transition here," he said, noting how bad news is mostly interpreted as bad news rather than good news that keeps the Fed at bay.
In addition to concerns over slowing global growth, analysts also noted some uncertainty over the timing of a rate hike.
"The Fed has created such a mixed message that people don't know what to do with their money," said JJ Kinahan, chief strategist at TD Ameritrade. "That makes (it) very difficult to figure out who are the winners and losers for the fourth quarter. People are taking money out of the market."
The CBOE Volatility Index (VIX), widely considered the best gauge of fear in the market, traded above 28.
The index was up more than 45 percent on the day, for its greatest weekly gain on record (going back to 1990) and up more than 100 percent month-to-date for August, on track for its largest monthly rise since 1990.
Earlier in the day, Kinahan said investors should start paying attention now that the VIX is above 20, and that anything over 25 indicates "true fear."
Still, "we're coming off such a quiet market, sometimes there's an overreaction," he said.
Peter Cardillo, chief market economist at Rockwell Global Capital, noted some volatility due to options expirations.
"At one point or another you're going to see some bottom fishing," he said. "Again, the trend for now is lower."
Major averages 5-day performance
Global markets extended losses on Friday. European stocks closed sharply lower, with the STOXX Europe 600 off more than 3 percent.
The Shanghai Composite plunged 4.2 percent after the China flash manufacturing PMI came in at a 6-1/2-year low.
"There's a lot of systemic fear with growth slowing in China ... but nobody really knows what the actual data is," said John Caruso, senior market strategist at RJO Futures. "With China taking the drastic measure of actually devaluing their currency (last week) many people are believing things are much worse than they're leading us on to believe."
Read MoreRelax, we're about to hit a bottom in stocks: Analyst
On the other hand, euro zone activity rose in August. The regional flash composite PMI from Markit rose to 54.1 from 53.9 in July. The U.S. flash manufacturing PMI came in at 52.9, slightly below expectations.
"I'd certainly be surprised if there's not a bit of a bounce, because a lot of what we know is not new," said Art Hogan, chief market strategist at Wunderlich Securities.
Treasury yields held lower, with the 10-year note yield at 2.05 percent and the at 0.63 percent.
The dollar fell about 1 percent against major world currencies, with the euro hitting a two-month high above $1.13 and the yen at 122.12 yen against the greenback. Emerging market currencies were weaker against the dollar.
Read MoreMarkets are in a technical mess
Growth fears and uncertainty about the timing of a Federal Reserve rate hike weighed heavily on Thursday. U.S. stocks plunged more than 2 percent, with the major averages closing at session lows below their 200-day moving averages. The Dow fell 358 points to below 17,000 and the S&P 500 ended at 2,035, in the red for the year so far.
"The SPX broke down from a triangle pattern yesterday on a significant increase in downside volatility. The decline led to a breach of important support at the March low, which defines the lower boundary of a six-month trading range," said Katie Stockton, chief technical strategist at BTIG.
"An important low appears likely next week from a technical standpoint, although the market may reel for another couple of days before finding its corrective low," she said.
Major U.S. Indexes
On the earnings front, Deere and Foot Locker posted results before the market open.
Read MoreEarly movers: DE, FL, HPQ, GPS, CRM, SYY, NVS & more
Deere plunged more than 8 percent after posting earnings $1.53 per share for its third quarter, 9 cents above estimates. However, revenue was below forecasts and Deere also lowered its forward guidance. The company said it is being impacted by a downturn in the farm economy and lower demand for construction equipment.
Foot Locker fell 3.7 percent after reporting earnings of 84 cents per share for its second quarter, 15 cents above estimates. Revenue was above analysts' forecasts as well, and a same-store sales increase of 9.6 percent exceeded estimates of a 6 percent rise.
The Dow transports fell 2.7 percent, with JetBlue leading all constituents lower. The index has been in correction territory for much of the year.
The Dow Jones Industrial Average closed down 530.94 points, or 3.12 percent, at 16,459.75, with Apple leading all blue chips lower.
The index has fallen 1,017 points this week and off 1,230 points for August. The index has only dropped more than 1,000 points or more in five other months in history, most recently in October 2008.
The closed down 64.84 points, or 3.19 points,, with information technology and energy leading all 10 sectors lower.
The Nasdaq closed down 171.45 points, or 3.52 percent, at 4,706.04.
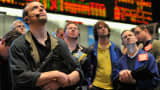
About five stocks declined for every advancer on the New York Stock Exchange, with an exchange volume of 1.3 billion and a composite volume of 5.0 billion in the close.
High-frequency trading accounted for 49 percent of August-to-date's daily trading volume of about 6.7 billion shares, according to TABB Group. During the peak levels of high-frequency trading in 2009, about 61 percent of 9.8 billion of average daily shares traded were executed by high-frequency traders.
—CNBC's Patti Domm, Gina Francolla, Christopher Hayes and Peter Schacknow contributed to this report
More From CNBC.com: