


We are back up on a positive trendline again.
And that's not because the markets were up huge on Wednesday, but because we broke through this key technical line:
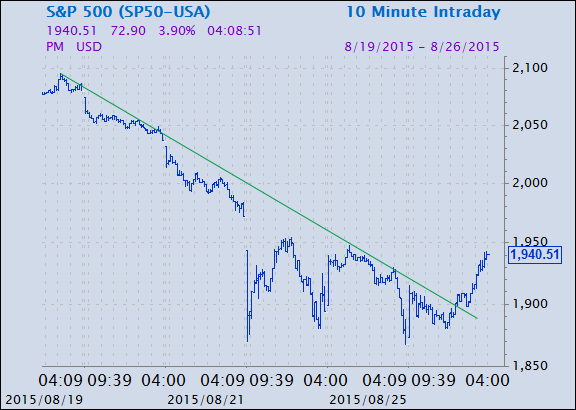
That's a chart of the S&P 500 going back to last week. The green trendline had been tracking the local highs. On Tuesday we reported that it didn't matter if the market was up on any given day because it would repeatedly touch the trendline and then fall back down. The only time we would know if the markets were truly "back" was if it could get over that hump: breaking through the trendline. Just being up on a single day wouldn't cover it.
Read MoreIf this chart is right, we might not recover until November
Well, here we are. U.S. stock markets all had huge gains Wednesday, including the S&P 500 being up almost 4 percent. The key level Wednesday was around 1,900, according to the trendline, which we were able to get through. The SPX closed at 1,940.51 on Wednesday, meaning we should expect to see more gains Thursday.
Remember, though, even if the market falls back down to 1,900 Thursday and bounces back, it's still tracking above the trendline. Don't think about the gains and losses compared to 4 p.m. on a previous day; that's just an arbitrary time cutoff. Look at these continuous charts to see how the overall sentiment of the market is moving.
Read More Don't trust your intuition during this market selloff

