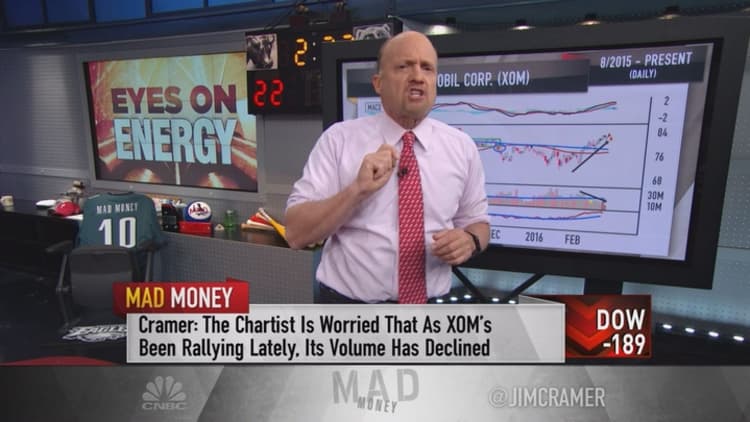
With the price of crude taking a nosedive after a tremendous run above $30, Jim Cramer wanted to get a sense about where major oil stocks could be headed.
"I'm a big believer in the lower-longer thesis — the idea that crude will stay down, likely for the rest of the year until he hedges expire at most of the American producers — but there's a lot of emotion invested in which way oil is going to jump," the "Mad Money" host said.
That is why Cramer turned to Robert Moreno, a chartist, publisher of RightViewTrading.com and a colleague of Cramer's at RealMoney.com. Specifically, Cramer was interested to know what the charts indicated for the large integrated oil and oil service plays if crude holds above $30.
These charts may look good right now, but you need to remember that this can all change in the blink of an eyeJim Cramer
Moreno looked at the daily chart of Exxon-Mobil and pointed out that the stock broke down below its 50-day moving average in early December, which sent it plummeting. It then went through an erratic period before rallying dramatically in a straight line for the last month.
Read more from Mad Money with Jim Cramer
Cramer Remix: Honeywell triggered a major trend
Cramer: Bernie Sanders 'buried alive', boosts stocks
Cramer: Low $30s is the magic price for oil
Moreno also noted that the Moving Average Convergence Divergence indicator, which helps technicians predict changes in a stocks trajectory, is tracking higher to reflect positive momentum.
However, Moreno worried that because the stock has rallied so hard lately, the overall volume has been declining. He interpreted the weak volume as an indicator that this run could be deceptive.
Overall, Moreno found that the technicals were sound for Exxon but is skeptical that the stock could continue to roar higher. Until the volume gets more positive, he suggested holding off.
Next up was Chevron, which was much more compelling for Moreno. Last week, the stock finally broke above a key level of $85 and is only a few points away from another ceiling of resistance at $89.
Moreno also found that the Chaikin Money Flow oscillator, an indicator technicians use to measure key levels of buying or selling pressure, was very positive for Chevron. He also liked that the stock has underperformed versus Exxon in recent months, and it could be poised to play catch up with Exxon.
Additionally, Moreno found that oil plays like Schlumberger and a riskier production stock like Pioneer Natural Resources could be ready to roar higher.
"We have to remember one key thing. These charts may look good right now, but you need to remember that this can all change in the blink of an eye if the price of oil keeps going down, which could ruin everything," Cramer said.
If oil can hold above $30 a barrel, than the charts will remain bullish and Cramer thinks Moreno could turn out to be right — even as he is skeptical that it could.
Questions for Cramer?
Call Cramer: 1-800-743-CNBC
Want to take a deep dive into Cramer's world? Hit him up!
Mad Money Twitter - Jim Cramer Twitter - Facebook - Instagram - Vine
Questions, comments, suggestions for the "Mad Money" website? madcap@cnbc.com


