In nearly 15,000 S&P 500 trading days, there have been 990 highs. That's 6.6 percent of the time. The vast majority of those highs lasted for fewer than five days. That means the typical trend for the market is to continue rising and setting new records.
When the market has hit a new high, only 19 times in the past did we have to wait more than 100 days for the next high to happen. We are in one of those periods now, having waited more than 250 trading days. The longest was more than five years' worth of trading days that started in January 1973.
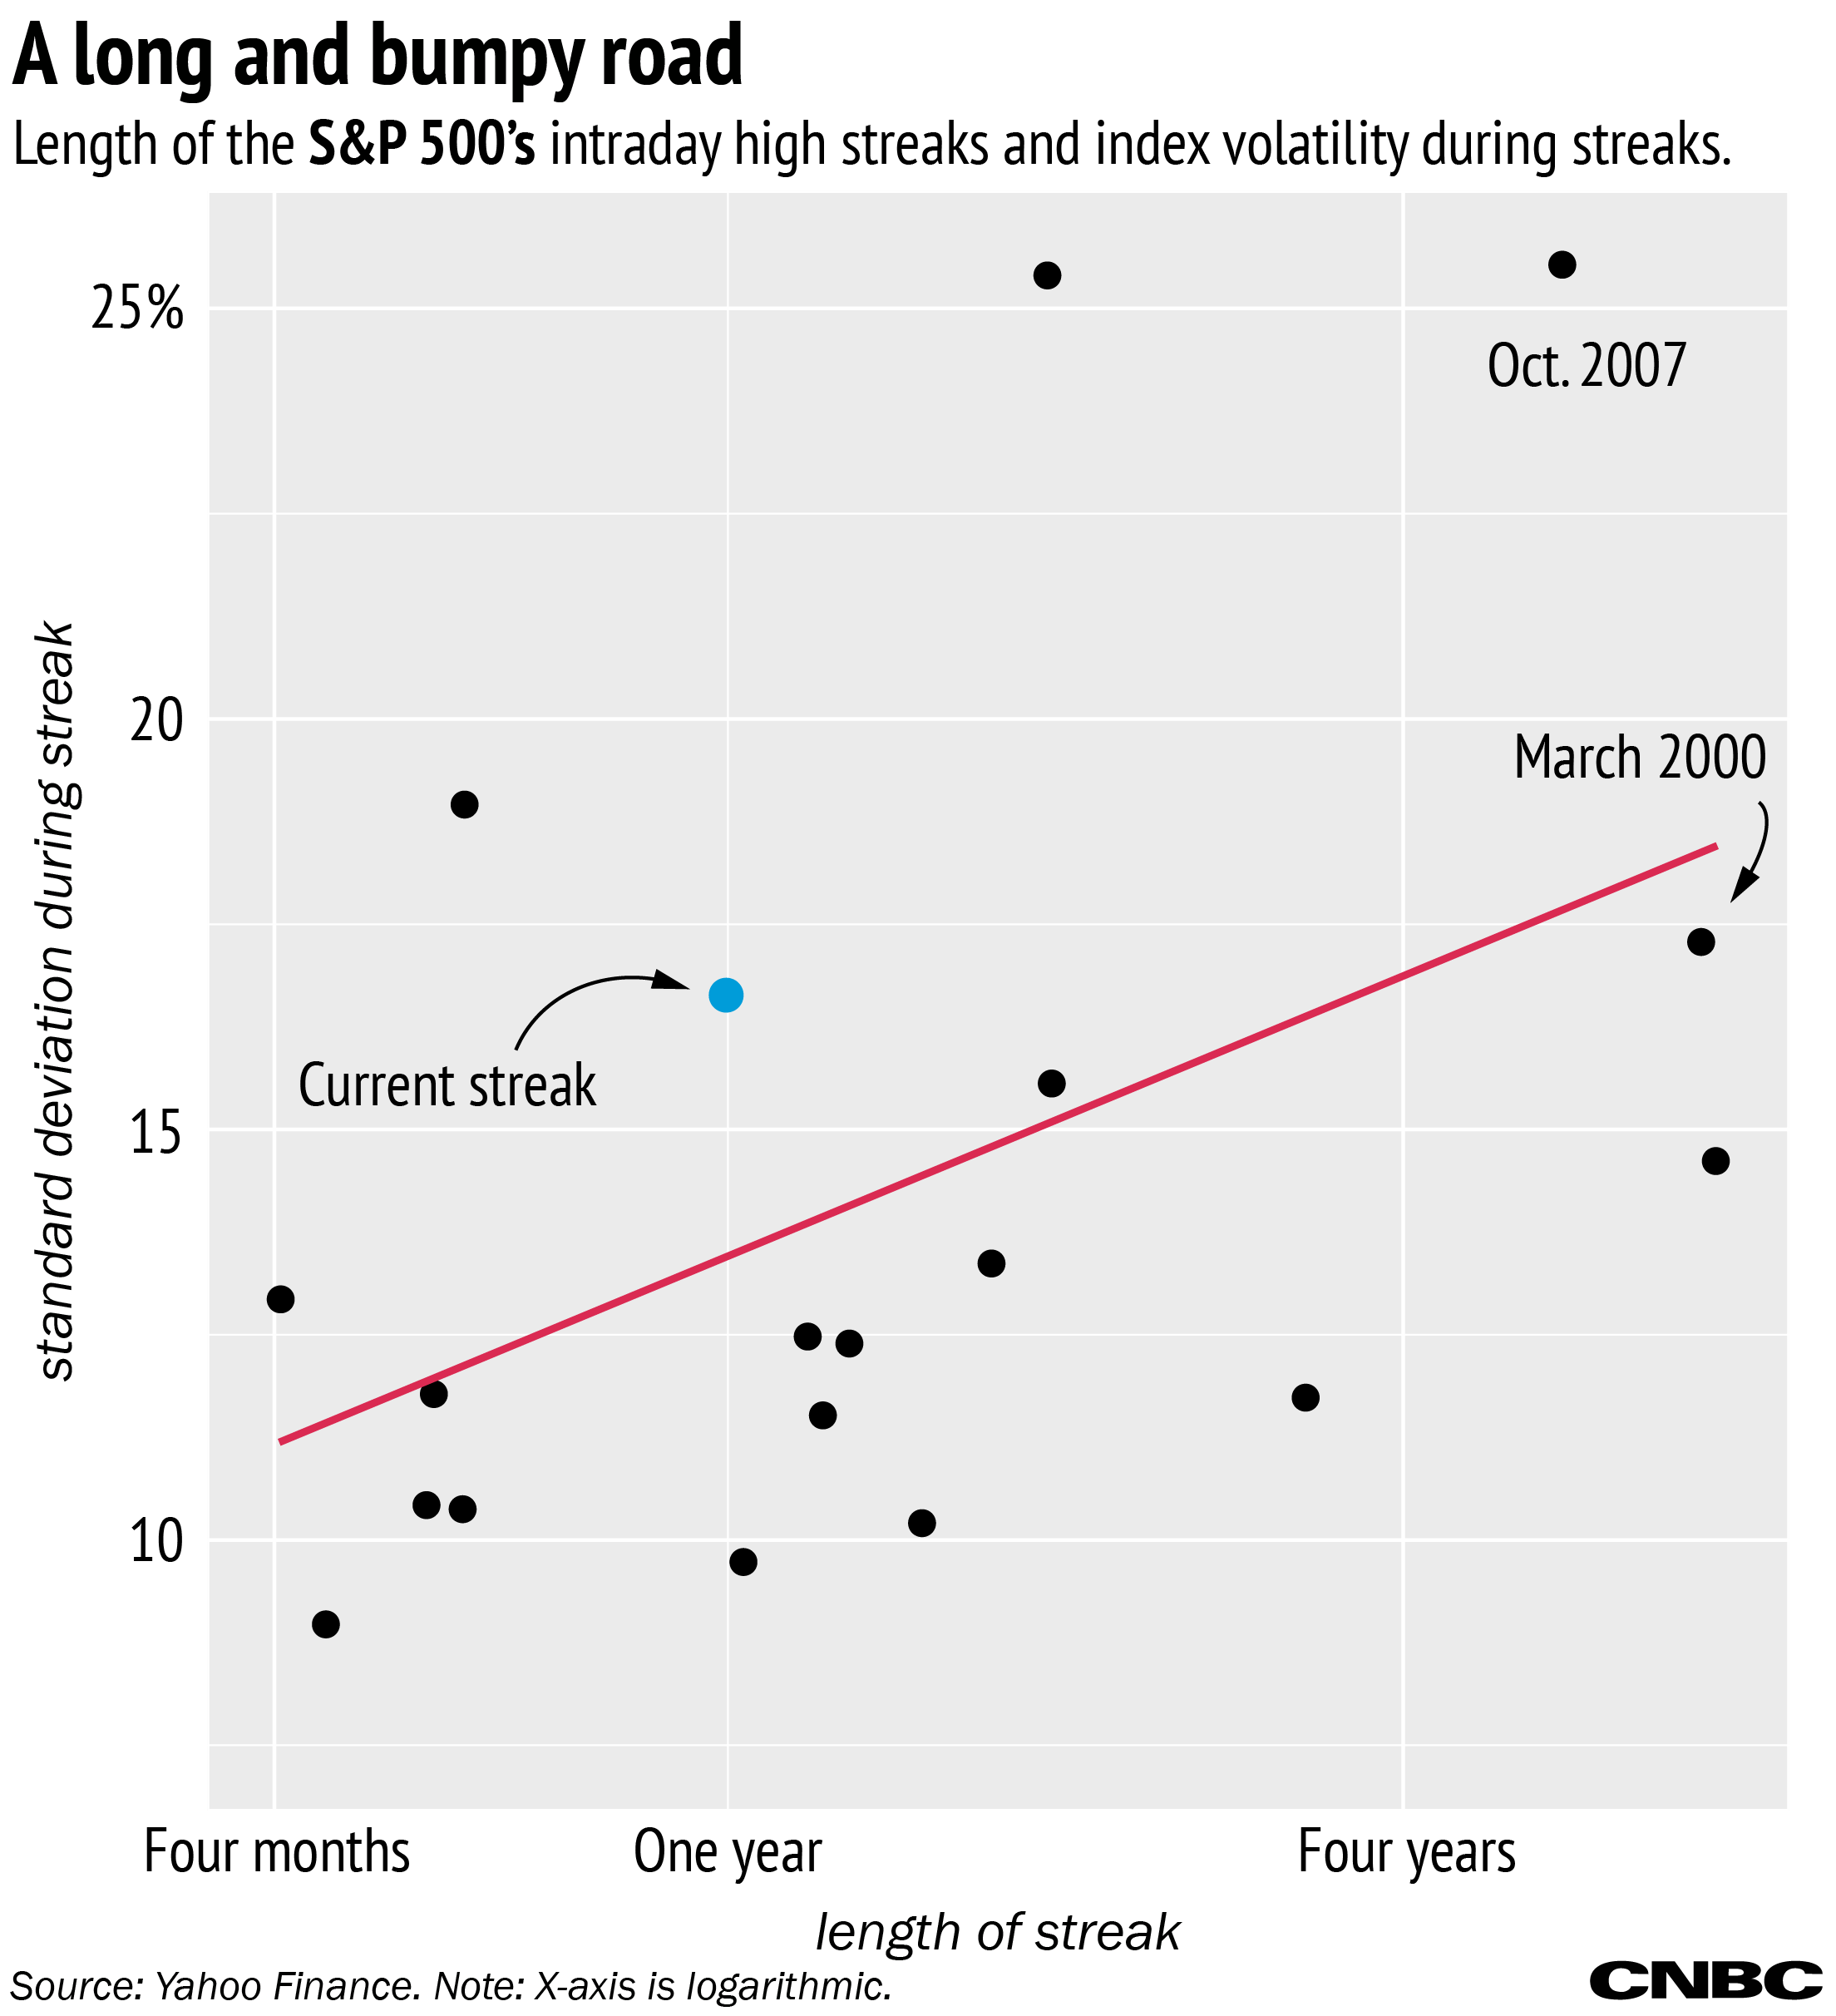
The two times in this century the market has been more volatile since the most recent high were following the dotcom bust in 2000 and during the financial crisis. The crisis streak began after a record high of 1,576 in October 2007. The market went 1,382 days without a new high until the bull market that eventually led to last year's record.
While investors could find it frustrating to see no new high in a year, it's not unusual, and there could be a long drought before any improvement. The 3.6 percent drop over the past year is on the low end for streaks this long. Normally, these high-water marks give way to precipitous falls: Think the 40 percent drop following the 2007 high or the 24 percent fall a year after the dotcom bust.