The next recession is already here—and there isn't much the Fed can do

Janet Yellen chair of the U.S. Federal Reserve
Win McNamee | Getty Images
Janet Yellen chair of the U.S. Federal Reserve

While investors have been focused on the perennial failed hope for a second half economic recovery, they have been missing the most salient point: the U.S. most likely entered into a recession at the end of last quarter.

That's right, when adjusting nominal GDP growth for core consumer price inflation for the average of the past two quarters, the recession is already here. But before we look deeper into this, let's first look at the following five charts that illustrate the economy has been steadily deteriorating for the past few years and that the pace of decline has recently picked up steam.

There is no better indicator of global growth than copper. Affectionately referred to as "Dr. Copper," this base metal has traditionally been a great barometer of economic health. Unfortunately, as you can see from the chart below, copper has been in a bear market for the past five years and shows no sign of a recovery from its 55-percent plunge.


Copper

Next, we have the Baltic Dry Index. This index measures the demand to transport dry commodities overseas. An advancement of this index would represent an increase in global growth. But as you can see, this index has been in a down-trend since the end of 2013 and fallen 75 percent from that point.

Baltic Dry Index

Source: CNBC

With both of these vital indicators pointing south, it should come as no surprise that Reuters recently reported that the Organization for Economic Co-operation and Development (OECD) said that global trade would only grow by, "2 percent this year, a level it has fallen to only five times in the past five decades and that coincided with downturns: 1975, 1982-83, 2001 and 2009."

There is little debate that the worldwide economy is stagnating, and despite what some would like to argue, the United States has not been immune from this slowdown at all.

Look at the spread between the two and 10-year Treasury notes. When this spread is contracting, there is increased pressure on banks' profits, which leads to falling loan growth and less economic activity. The spread has been narrowing since July 2015 and is now the tightest since November 2007.

Spread between 2- and 10-year Treasury notes

Then we have industrial production, which measures the output of factories, mines and utilities in the U.S. economy. According to the Wall Street Journal, industrial production is faltering:

"Overall industrial production peaked in November 2014 but has failed to regain that level amid a mining sector collapse and leveling off at factories. Overall industrial production was down 1.4 percent in the 12 months through May. Utility output is down 0.8 percent and mining output has plunged 11.5 percent."


Industrial production

And the once crowned jewel of the post-Great Recession economy, the lagging economic indicator known as the non-farm payrolls report, is also rolling over fast. Last month's disappointing 38k net new jobs created was written off by some as an anomaly, but the chart below shows that this was actually part of a declining trend that has been in place since October 2015.


U.S. nonfarm payrolls

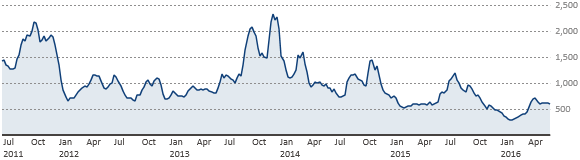
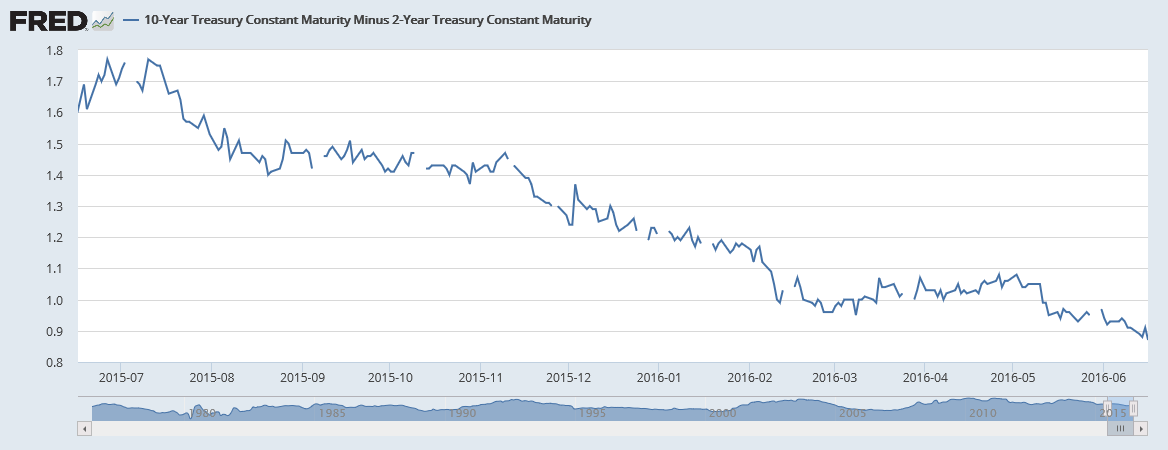
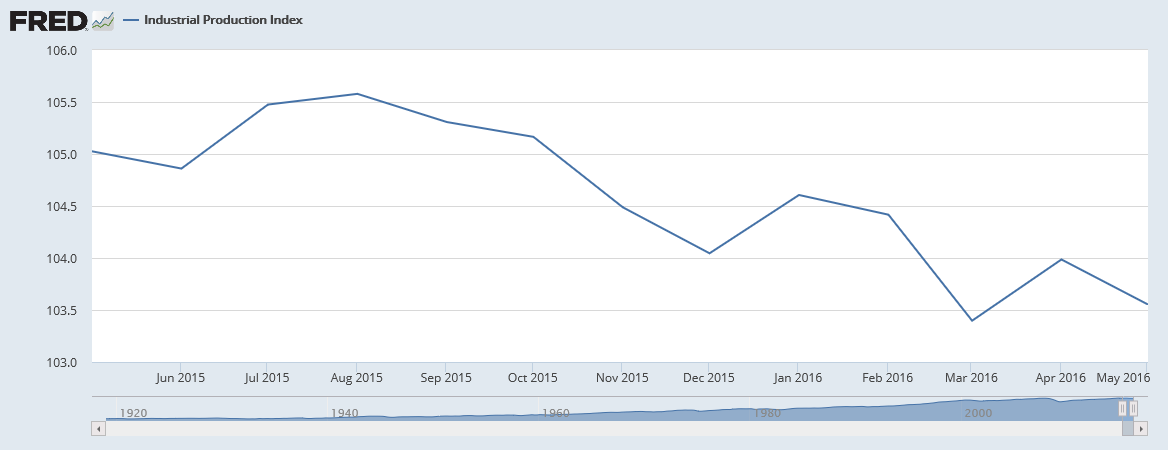
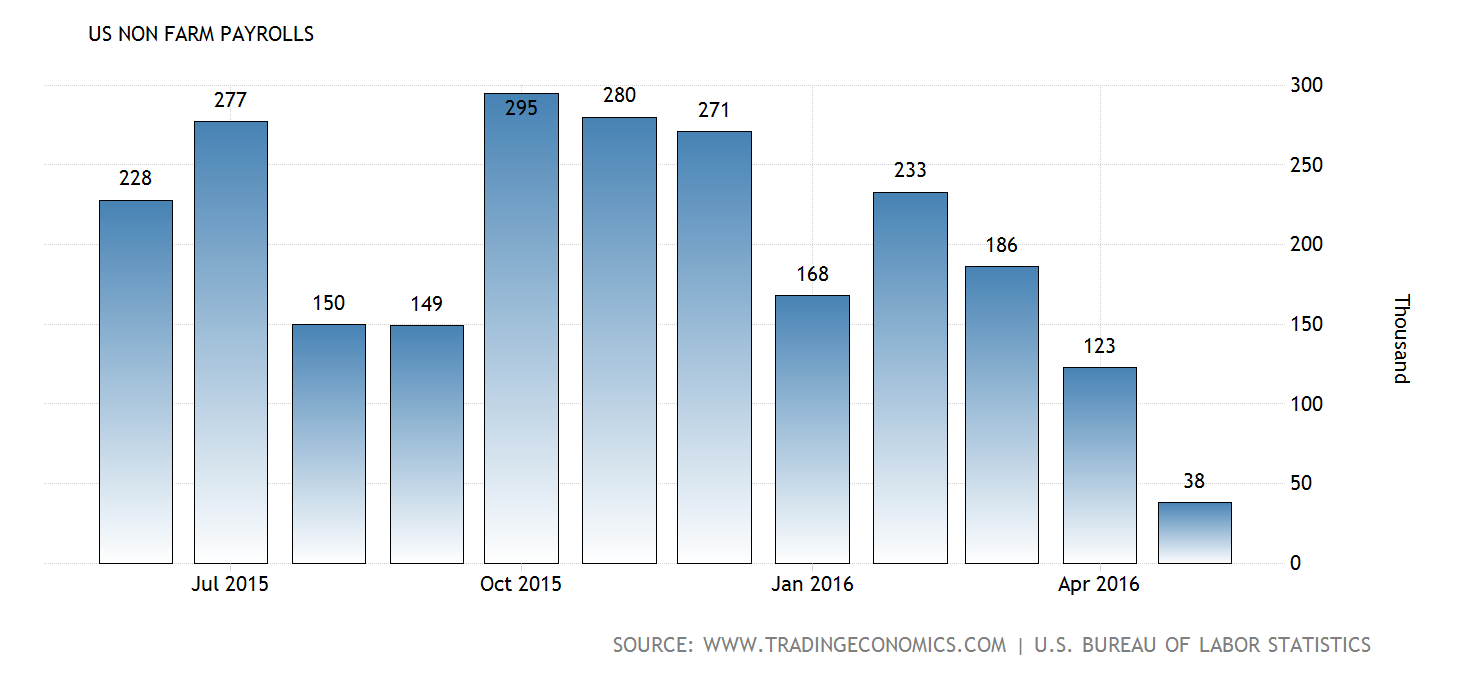
The falling copper price, tumbling global trade, a flattening yield curve, weakening industrial production and the rolling over of monthly job creation all point to an economy headed into contraction.

But as mentioned earlier, to confirm that this recession may have already arrived, we need to look no further than the data published by the Bureau of Economic Analysis (BEA) and the Bureau of Labor Statistics (BLS).

The definition of recession is two consecutive quarters of negative GDP growth, according to the National Bureau of Economic Research, though that is not an official designation. During Q4 2015 and Q1 2016, real GDP posted 1.4 percent and 0.8 percent growth, respectively—so officially we're not in one yet. However, when deflating nominal GDP by the core rate of Consumer Price Inflation (CPI) published by the BLS, you get real GDP of just 0.3 percent in Q4, and negative 0.8 percent during Q1. Therefore, the economy is dangerously close to a contractionary phase; and is already in one when averaging the prior two quarters (at minus 0.25 percent when adjusted by core inflation).

It took 1.5 years to bring the economy out of the Great Recession that began in December 2007. And it took a $3.7 trillion increase in the Federal Reserve's balance sheet, plus 525 basis points of interest-rates cuts to pull us out. The major problem is that stock market is now pricing in a strong recovery from the four quarters in a row that the S&P 500 has posted negative earnings growth. Another year, or more, of falling earnings for equities would result in a devastating bear market.

The Fed already has a bloated balance sheet in relation to GDP and only a few basis points to reduce borrowing costs before short-term rates hit zero percent. Therefore, there just isn't much the Fed can do this time around. Therefore, this next recession could last even longer than the previous one.

The stock market is pricing in perfection and is ill-prepared for a protracted recession that may already be underway. Prudent investors should hedge their portfolios now from such an unwelcome event.

Commentary by Michael Pento who produces the weekly podcast "The Mid-week Reality Check,"is the president and founder of Pento Portfolio Strategies and author of thebook "TheComing Bond Market Collapse."

Follow CNBC's Opinion section on Twitter @CNBCopinion.

Correction:
The definition of recession is two consecutive quarters of negative GDP growth, according to the National Bureau of Economic Research, though that is not an official designation. An earlier version of this article misstated that it was the Bureau of Economic Analysis.