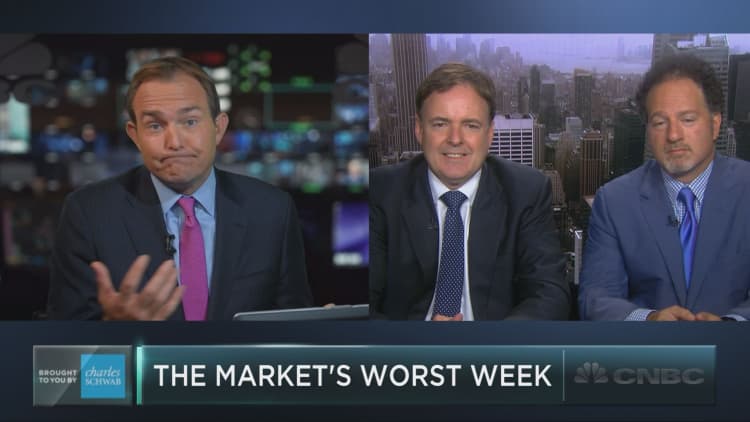
If history is any guide, stocks are set to slide.
September is known as a bad month for stocks from a seasonal perspective. It turns out that some technical analysts get even more specific than that. Ryan Detrick of LPL Financial has found that since 1950, the worst week for the S&P 500 has on average been the 38th week in a given year.
This week happens to be the 38th of 2016.
Detrick goes on to point out that the S&P's average return in a year's 38th week is minus 0.61 percent, and that the market has dropped in the 38th week in seven of the eight previous years.
Larry McDonald of ACG Analytics offers a potential explanation: Asset managers who are doing well in a given year may try to "protect gains" amid any glimmer of uncertainty. That is, funds beating the market in a given year will have an extra incentive to sell stocks in order to protect their annual performance number.
Still, McDonald added Monday on CNBC's "Trading Nation" that he "wouldn't put a lot of stock" in the market factoid, preferring instead to look to central bank actions as well as the presidential election to make his broad-market calls.
Zachary Karabell of Envestnet adds that "if patterns were destiny in financial markets, then the only people who would be making a lot of money would be chartists and quants," which does not appear to be the case.
For his part, Detrick writes: "Should this weakness occur, we would not view this as a reason to panic; instead, we would likely consider buying the dip, as we are looking for equities to end the year near current levels."
Stocks didn't suffer a particularly tough beginning to the week; the S&P 500 fell 0.04 points on Monday, its smallest single-day drop since 2012.


