A market downturn may not be such a bad thing right now

After a weak March, April isn't starting off any better.

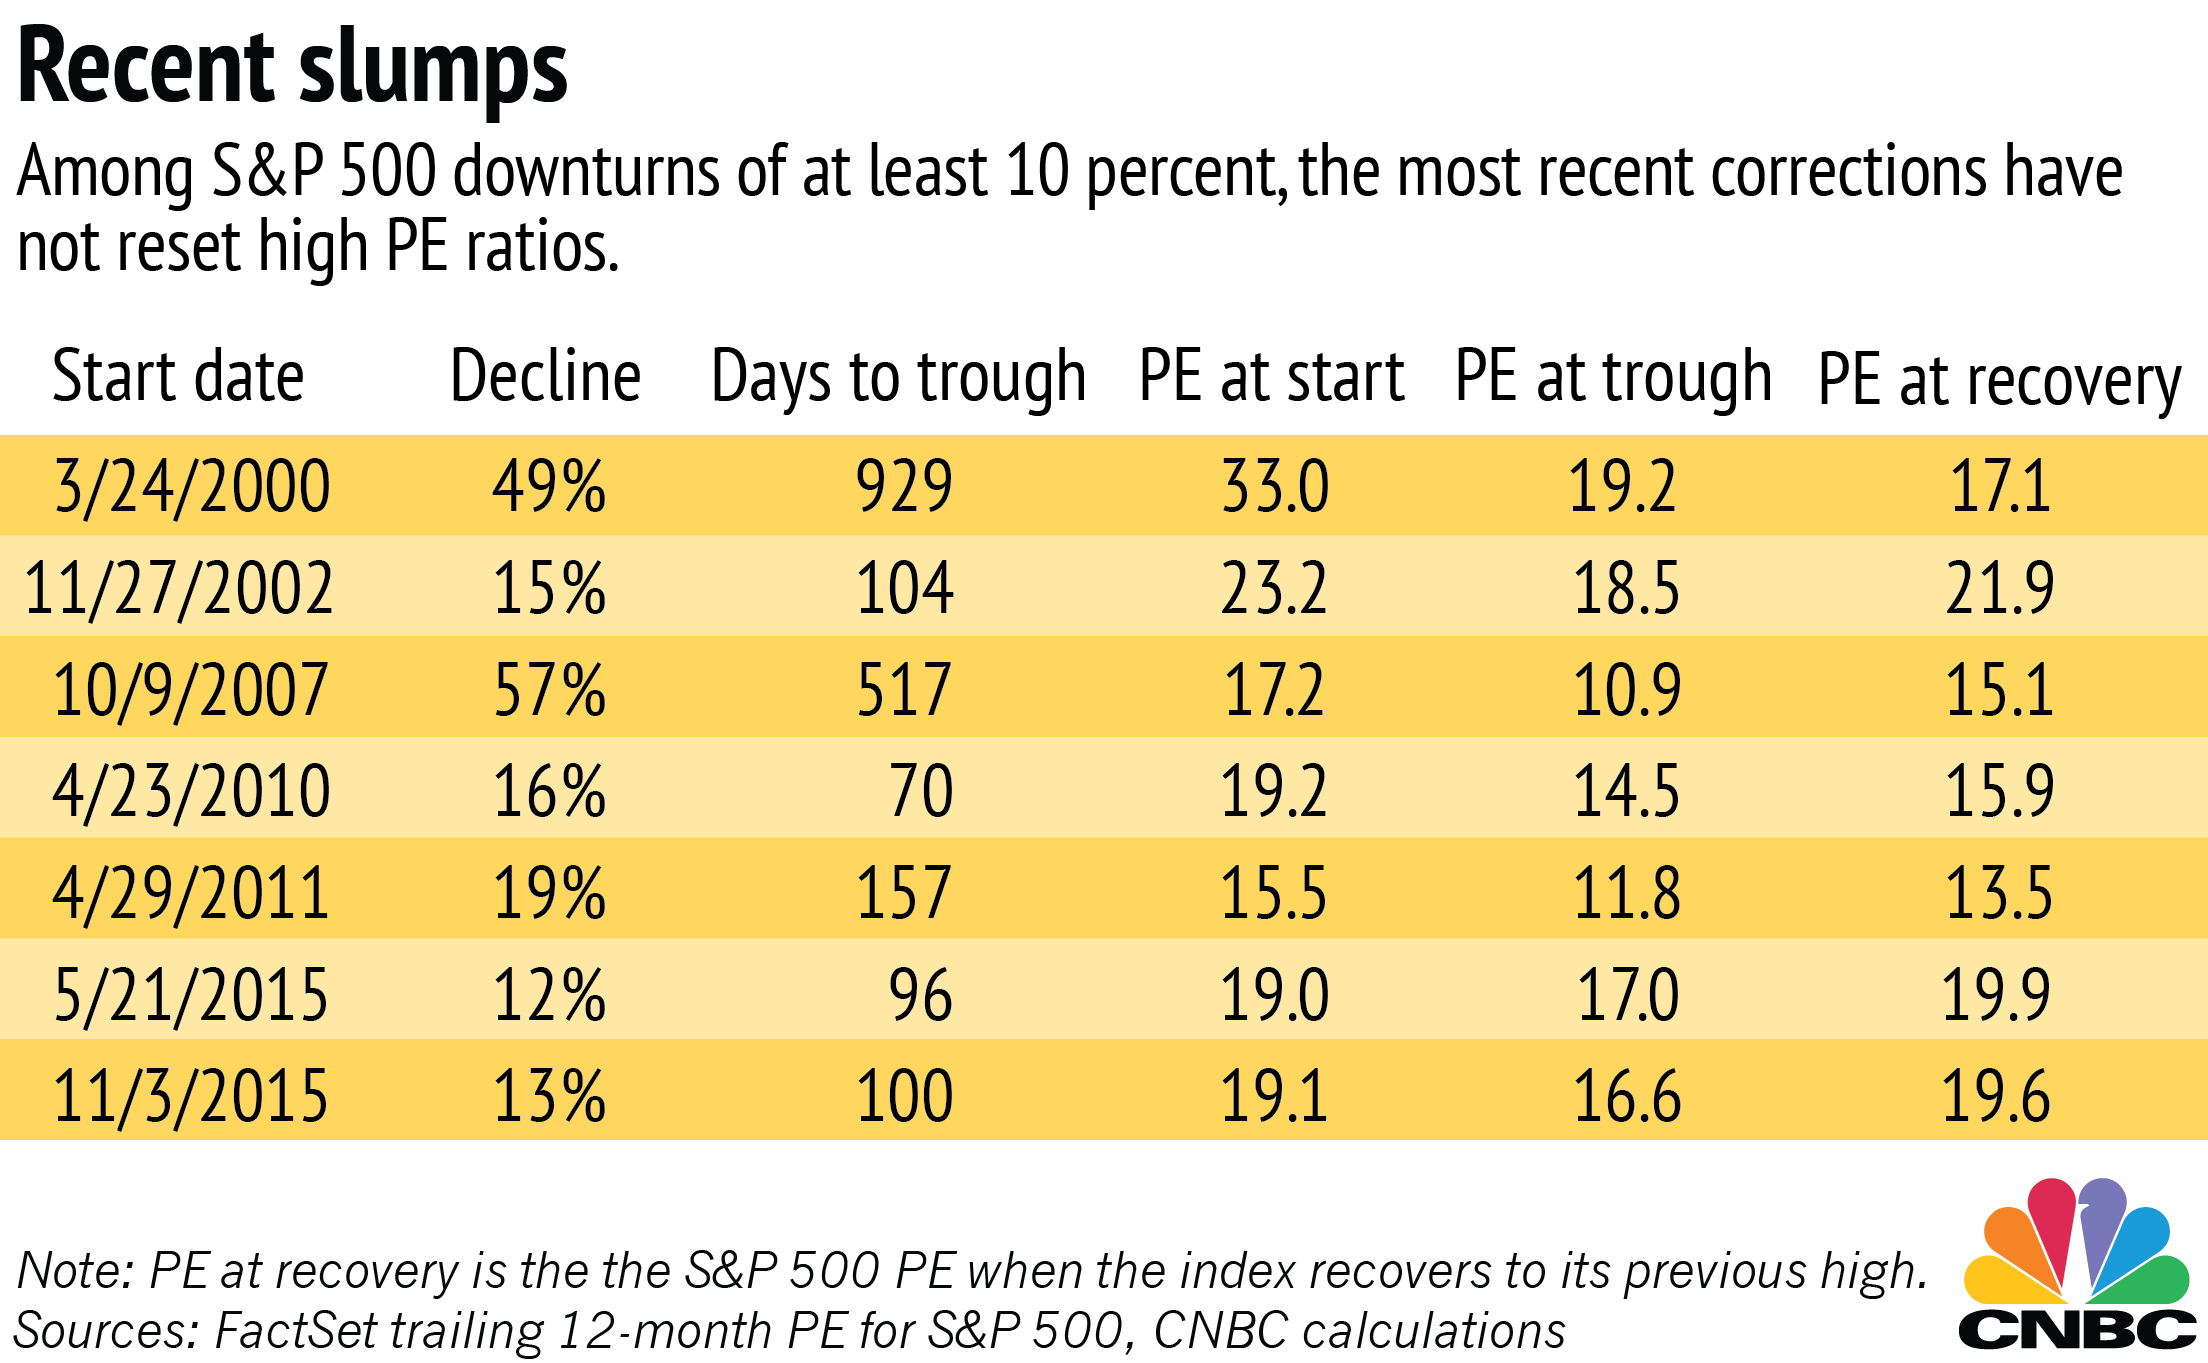
Recent performance is raising the possibility of a market correction that would bring valuations more in line with corporate earnings, and it would take at least a 20 percent decline in the S&P 500 for price-to-earnings ratios to return to their recent averages.

High valuations are just one of many factors that could be signs of a correction in the near future. Analysts have also pointed to falling commodity prices and political disappointments that could usher in a downturn. Other investors are hoping for a correction to keep the market healthy and in line with fundamentals.

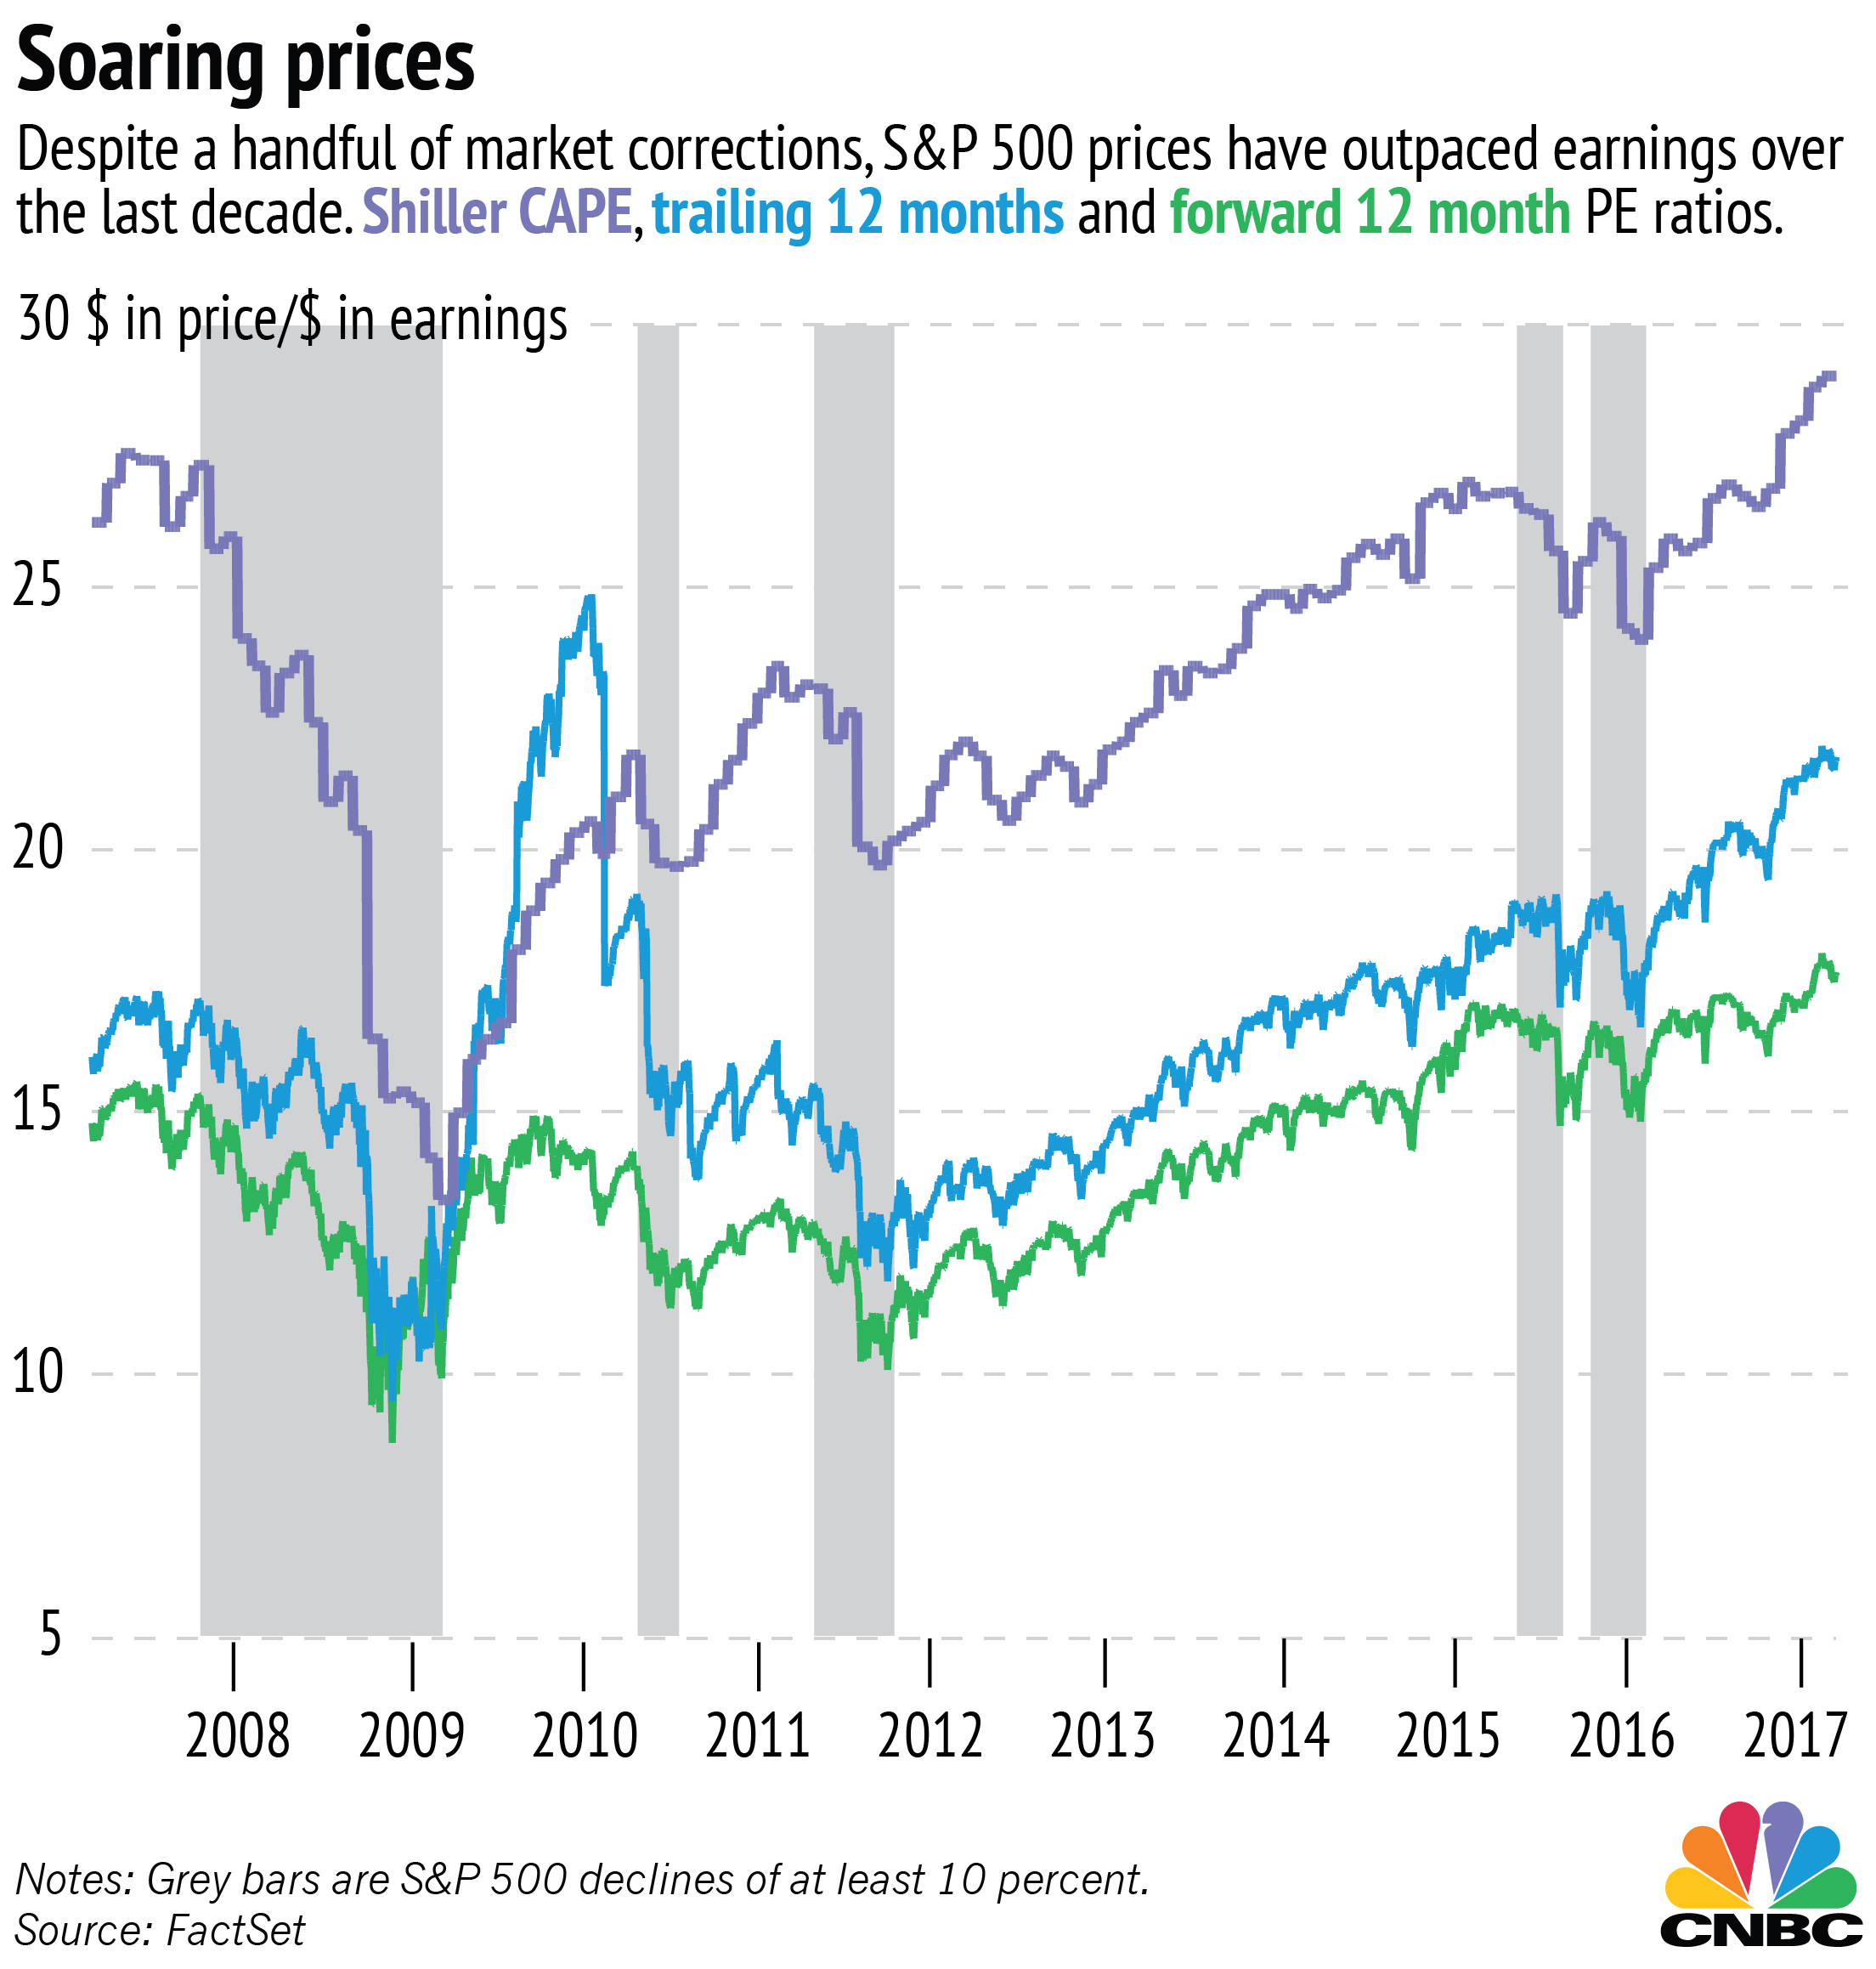
Stock prices are about 22 times more than the last year's earnings, compared with a 10-year average of about 16. The cyclically adjusted price to earnings ratio (CAPE) is near 30, compared with a recent average of about 23. The market has had a number of minor corrections since the Great Recession, but they have done little to slow price gains relative to earnings.

Each of those metrics is at least 25 percent over their 10-year averages, implying that it would take a significant drop in the S&P 500 to reset prices to an average valuation. It's difficult to know what the true value of a dollar in earnings should be.

The CAPE ratio, a metric devised by Nobel Prize-winning economist Robert Shiller, has been shown to be a useful tool for forecasting returns over the long term, but it can be misleading for short-term market timing. Studies have indicated that the metric may be overly pessimistic and could be driven upward by changes to how earnings have been reported since the 1990s.

But the 12-month and CAPE ratios aren't the only valuation measures that have crept higher over time. The alternative NIPA metric, which compares prices to government corporate income statistics, is also slightly over its long-term average. And Warren Buffett's preferred comparison of the Wilshire 5000 whole market index to gross national product shows a similar pattern.

Investors themselves also seem to be noticing some froth: In the most recent Bank of America Merrill Lynch survey of fund managers, more said the market was overvalued than any time since the survey began 17 years ago.

Generally, corrections of at least 10 percent bottom out below the average PE and can give earnings time to catch up with prices. But the last two corrections in 2015 didn't do much to reset high PE values — prices bounced back faster than earnings increased, so PE continued to climb.

According to a list of historical corrections and bear markets compiled by Yardeni Research, the median interval between a correction's trough and the start of the next correction is 325 days. It's been more than 400 days since the end of the last correction in 2015. A Goldman Sachs strategist recently told CNBC that the chance of a correction is "quite high," but that it likely wouldn't kill the bull market entirely. Since 1950, only about 30 percent of declines of 10 percent or more have turned into full-blown bear market losses of at least 20 percent.

A small correction could be a good thing for investors, because there is some evidence that longer runs without a corrections can lead to more destructive crashes. To keep the market healthy, investors should be crossing their fingers and hoping for enough of a downturn to let earnings catch up with prices and to create buying opportunities.