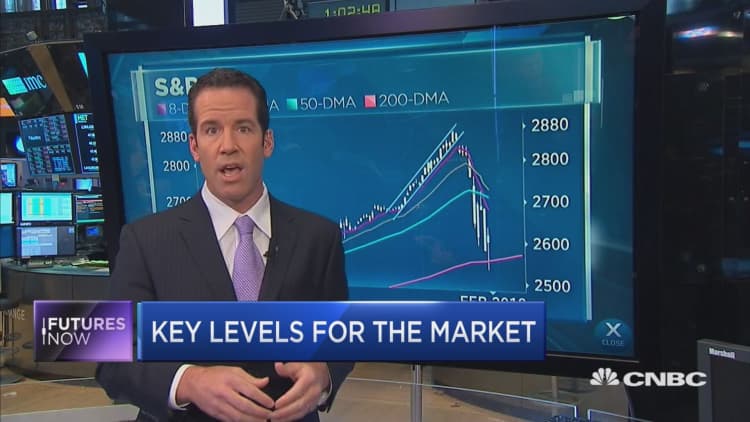
Tuesday's decline in major stock indexes was nothing more than a breather in the comeback rally, says Scott Redler of T3Live.com, and he has two charts to back up his argument.
Redler said the rally has put the S&P 500 above a few key technical indicators. He specifically pointed to the S&P 500's eight-day, 21-day, and 50-day moving averages, citing the index's rebound above those levels as a key sign of "power" in the market.
"We didn't get rejected. You went through the moving averages and actually reclaimed them," he said Tuesday on CNBC's "Futures Now."
The key here is that Redler saw previous resistance at around the 2,670 level, and the S&P managed to also break through that resistance. This also convinces Redler that the market could reclaim its previous highs by rebounding to the 2,880 area.
With Tuesday's pullback, Redler does believe that the market hit a resistance at 2,780, but that support is actually sitting at 2,730. The latter is the level at which the S&P broke above the three moving averages.
"We just hit a little resistance today around 2,780," he said. "I do think we could work our way back to the highs especially considering that tech's been very strong, the banks are strong. We just don't want to see those yields on the 10-year get too much above 3 percent."
The S&P closed at 2,744.28 on Tuesday.


