The notion that the Australian dollar is a commodity currency took another bashing last week. The collapse of the Aussie below parity against the U.S. dollar in reaction to the surprise interest rate cut by Australia's central bank demonstrated the clear linkage between interest rates and the Aussie.
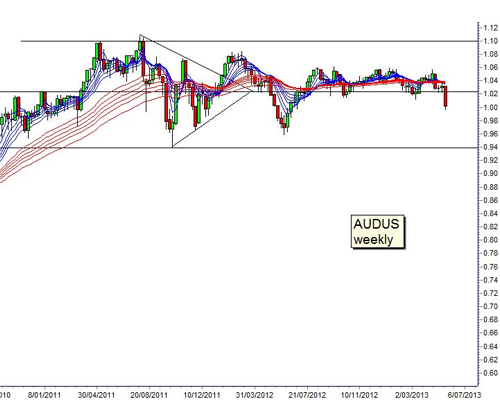
Is this a major change in the trend? Analysis of the weekly chart suggests this movement is within the limits of the broad trading range that has dominated the Aussie movement since April 2004. The Aussie peaked near $1.10, touching this level on several occasions in 2011. This created a resistance level that was never subsequently challenged again.
Setting the support level is a little more difficult. We locate support near $0.94. The reason for this is based on the symmetrical triangle pattern that developed in the second half of 2011. The pattern has a peak near $1.10 and a low near $0.94. This was the base of the symmetrical triangle pattern. It was also a resistance level in November 2009 and April 2010.
(Read More:
Why Shorting the Aussie Is 'Trade of the Century'
)
The symmetrical triangle is a pattern of indecision. It shows that neither the bulls nor the bears can gain the upper hand. The weak breakout on the upside in January 2012 failed to reach resistance near $1.10.
The breakout heralded the beginning of a prolonged sideways trading pattern which oscillated around $1.02. In the second half of 2012 and the first part of 2013 the volatility of this oscillation declined with the Aussie moving between $1.02 and $1.06. This was a trendless and directionless market driven by stubbornly high interest rates in Australia. There is no reaction to the substantial decline in commodity prices during this period.
The surprise interest rate decision, along with the surprise employment figures conspired to push the Aussie below $1.02. The downside target is between $0.94 and $0.96. This movement is a renewal of the volatility within the broad trading band between $0.94 and $1.10. It is not necessarily the signal of a new downtrend in the Aussie. It remains a good shorting opportunity as it moves towards $0.96, but it does not have the characteristics of a long term downtrend.