How to Trade Oil Given the Egypt Crisis

Justin Sullivan | CNBC

On the morning of July 3, on CNBC we talked about the developing situation in Egypt. We looked at two charts. The first was Nymex oil just starting to move above $100/barrel. The second chart was the Egyptian EGX 30 market index. There was an interesting divergence, and this opened the way to a trading strategy.

The EGX30 was showing a strong rally. This suggested the market was expecting a rapid resolution of the current problems and a return to stability. Frightened money flees markets, causing them to crash. Confident money stays in markets. This is what was happening in Egypt with the market rallying.

(Read More: Oil Rally Not Just About Egypt: Deutsche)

So what's the trading solution in this environment? It's a SAR – stop and reverse trade. This is a rally trade. It's not a trend trade. We expect this to be a short term momentum pop, followed by a retreat back to under $100. It starts with trading from the long side with upward momentum. Entry is as near to the $100 breakout as possible. The stop loss is calculated using the Guppy count back line. This is a self adjusting volatility based stop.

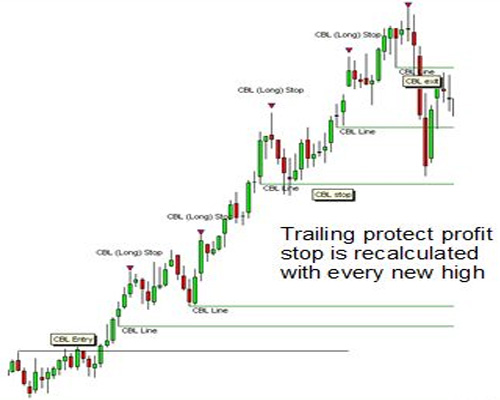
The stop distance from the current price changes as the significant volatility of price changes. On the day of entry the count back line is calculated from the high of the previous day. The count back line is the stop loss. The position of the count back line is adjusted whenever a new daily high is made. A close below the count back line (CBL) is a signal to exit the trade.

This is shown in the schematic trading diagram with a trending stock. The SAR trade with Nymex oil has the long side stop placed at $99.55 with the entry at $100.80. As the trade develops the CBL is recalculated and follows, or trails, the rising momentum. The long side trade is closed when there is a close below the trailing stop loss level.

(Read More: Brent Set to Test $110 Mark)

As soon as the long side trade is closed we switch to a stop and reverse trade. A short side trade is opened. The CBL calculation is also reversed. The new lows are used as the calculation point. The count back line is placed three significant volatility moves above the most recent lowest low. The trailing stop loss follows the downtrend. A close above the stop loss line is a signal to cover shorts.

This volatility stop loss method is discussed in my book "Guppy Trading." We prefer this to the parabolic SAR which uses a fixed volatility calculation that is not as responsive to significant changes in volatility.

This was the trade plan discussed on July 3. We will follow this trade as it develops.

Daryl Guppy is a trader and author of Trend Trading, The 36 Strategies of the Chinese for Financial Traders –www.guppytraders.com. He is a regular guest on CNBC Asia Squawk Box. He is a speaker at trading conferences in China, Asia, Australia and Europe.

If you would like Daryl to chart a specific stock, commodity or currency, please write to us at ChartingAsia@cnbc.com. We welcome all questions, comments and requests.

NBC assumes no responsibility for any losses, damages or liability whatsoever suffered or incurred by any person, resulting from or attributable to the use of the information published on this site. User is using this information at his/her sole risk.