


(Click for video linked to a searchable transcript of this Mad Money segment)
Jim Cramer is a fundamental investor. That is, when he picks stocks, he's most influenced by the business prospects of the underlying company, which includes the health of the balance sheet, the abilities of the executives and the strength of the profits margins.
However, the "Mad Money" host also believes that technical analysis warrants consideration, especially when the market appears to be at a point of inflection.
And with stocks finally making new all-time highs, after struggling to break out for weeks, the market is clearly at a point of inflection.
Therefore, to get a sense of what may lie ahead, Jim Cramer turned to analysis from Carolyn Boroden of FibonacciQueen.com.
And although Boroden says the long-term bullish trends remain intact, bearish signs are starting to surface. "It suggests the S&P 500 is balanced on a knife's edge," said Cramer. Here's what you must know:
1. Boroden is concerned that time is not on the side of the bulls. That's because the length of the last bull market, from the lows of October 2002 to the peak in October of 2007, totaled 60 months. The current bull began in March 2009. It has now lasted 61 months. Boroden says it's not uncommon for market events to last for about the same amount of time. That would suggest the bull is coming to an end.
2. The S&P has met Boroden's upside target of 1823 which was determined using Fibonacci ratios. Although the analysis doesn't rule out a further advance, it seems more likely that the path of least resistance should be lower. That's particularly true if the S&P stalls out right at current levels because it would suggest a double top, a bearish pattern.
3. Fibonacci analysis suggests 1881 to 1920 could present a very powerful ceiling of resistance in the S&P. Unless the index can pierce these levels, Boroden doesn't think the market will simply consolidate. Instead, she thinks the market will swoon.
Although these catalysts suggest a sell off may lie ahead, it remains unclear how steep the decline could be.
And technical analysis is anything but definitive on this point.
Boroden says that if a decline stops before the S&P hits its early February low of 1751, then, she thinks the decline will be what Jim Cramer calls a 'garden variety decline.' That is, a buying opportunity ahead of the next leg higher.
However if the S&P drops below the February low, then Boroden's analysis says investors could be facing a serious problem—it might indicate that the market has peaked.
---------------------------------------------------
Read MoreMad Money with Jim Cramer
Up 300% in a year, Cramer says sell
Why are sellers hitting good stocks?
3 themes losing market muscle?
---------------------------------------------------
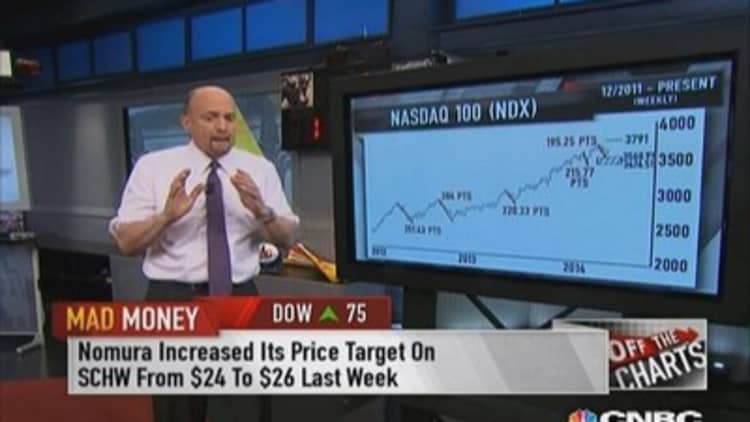
But before you run for the hills, it's worth noting that Boroden thinks patterns in the Nasdaq 100 paint a very different picture.
She says the recent decline in the Nasdaq 100 takes the index back to the February lows; that's a roughly 61.8% retracement and a key Fibonacci ratio. Therefore, Boroden thinks the tech heavy index could bottom and ultimately rebound.
In other words, the Nasdaq 100 patterns are relatively bullish while the S&P 500 are relatively bearish.
Jim Cramer believes all the patterns warrant attention.
"Although tech may be about to rebound, I can't be all sunshine and rainbows," he said. Trend lines in the S&P must be taken very seriously. "The S&P, and by extension the whole market, could be at a precarious moment. Ultimately, the charts advise caution."
Call Cramer: 1-800-743-CNBC
Questions for Cramer? madmoney@cnbc.com
Questions, comments, suggestions for the "Mad Money" website? madcap@cnbc.com