


With the recent collapse of oil prices across the country, the question on every investor's mind is where the bottom of oil could be, and when will we have a tradeable bottom for it to rebound?
To answer this question Jim Cramer turned to the charts and consulted Carolyn Boroden, a technician who runs the FibonacciQueen website and is Cramer's colleague at RealMoney.com.
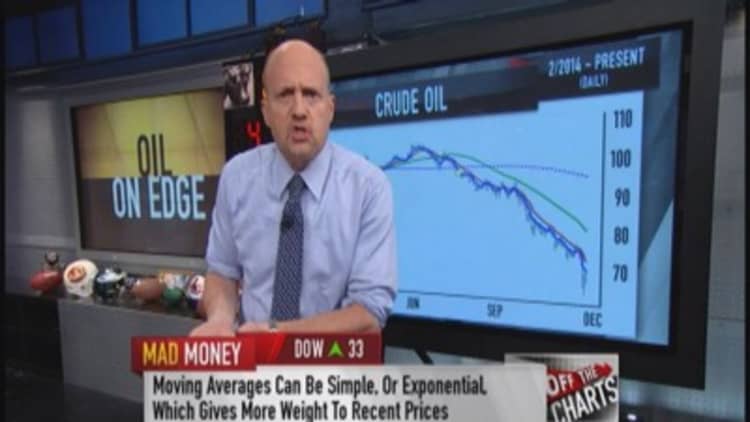
According to the charts, the immediate trend in oil is bearish as it continues to make still lower lows. But the charts have been showing bearish signs for months now, so this is not a new revelation.
"Now, here's the problem: If you wait for these signs to reverse themselves, if you wait for oil to start making higher highs and to cross above its key moving averages, you're going to miss any potential rebounds, because by the time that all comes together you're likely to have already seen a huge rally," the "Mad Money" host said.
That is why Boroden conducted a Fibonacci analysis, to see if it can provide insight on when oil will bottom for investors to have a tradable low in the market.
Leonardo Bonacci, who went by the nickname of Fibonacci, was an Italian mathematician from the Middle Ages who found that a series of key ratios tend to repeat themselves over and over again in nature. Those same ratios tend to also show up as key levels in the stock market, and Cramer has seen this work many times in the past.
Based on Boroden's analysis, she spotted that the Fibonacci relationships tended to cluster around $64. That is roughly the price where oil bottomed on Friday, giving her a case to believe that this could also be where oil bottoms in the future as well.
However, if oil fails to hold at this level—then there is pain, pain, pain ahead.
"She doesn't see any more support on this time frame until we hit the next cluster of Fibonacci relationships at the $50.47 to $51.90 level, which could represent another nasty leg down for crude," added Cramer. Yikes!
Boroden said she would feel bullish if oil's five-day exponential moving average crosses above the 13-day exponential moving average on the daily chart, or if we get a rally that lasts longer than previous rallies during a period of decline. She also added that in order for her to think that oil really has legs; the oil futures would need to break out over $69.80. Until then, she is staying cautious.
----------------------------------------------------------
Read more from Mad Money with Jim Cramer
Cramer Remix: The best stocks to own
T Boone Pickens tells Cramer: $100 oil will return
Why you should stop bottom fishing for stocks
----------------------------------------------------------
In short, while the Fibonacci analysis shows that oil could be due for a bounce, Boroden is not on board yet. If the oil futures can rally a few more points, then she will be bullish. On the other hand, if oil continues to collapse than there could be enormous pain headed into the oil patch, potentially dropping as low as $50.
"Frankly, that's a pretty subpar risk reward and it confirms my thinking that you can't expect a swift rebound in the price of oil to occur at any time soon," said Cramer.
Questions for Cramer?
Call Cramer: 1-800-743-CNBC
Want to take a deep dive into Cramer's world? Hit him up!
Mad Money Twitter - Jim Cramer Twitter - Facebook - Instagram - Vine
Questions, comments, suggestions for the "Mad Money" website? madcap@cnbc.com