


Jim Cramer wants investors to start preparing for the inevitable. Friday's terrific employment report made it very clear that the Federal Reserve has no choice but to raise interest rates at its next meeting in December, and rate hikes are not good for a vast majority of the stock market.
There is one sector that will do better when the Fed tightens, and that is the financials. This is because when rates go up, banks will make more money from customer deposits.
"As we head into the next Fed meeting, you will have to believe the big institutional money managers will be buying the banks hand over fist," the "Mad Money" host said. (Tweet This)
That is why Cramer turned to Tim Collins, a technician and colleague at RealMoney.com, to take a look at what the charts have in store for financials going forward.
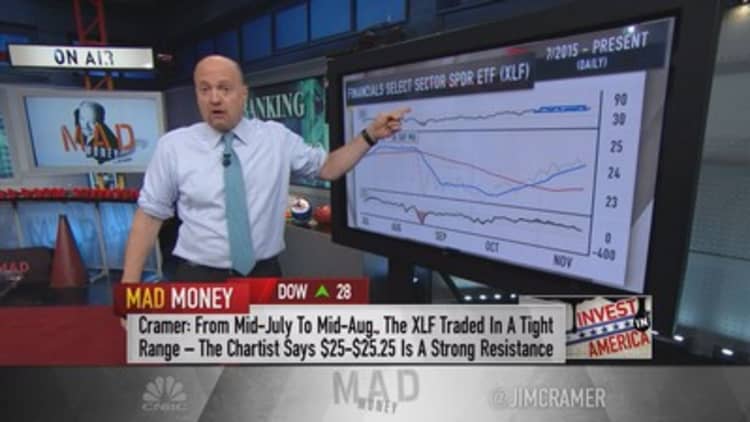
When Collins took a look at the daily chart of the XLF — the S&P financial ETF that contains all of the big banks — he saw a group that has been strong recently but could be at risk.
The moment the Fed raises interest rates, the earnings power for all the banks gets much stronger.Jim Cramer
Ever since the marketwide bottom in September, financials have been working their way higher. Collins is concerned that after the sell-off on Monday, the XLF could be in danger of breaking down below its floor of support.
Collins was also worried when he looked at the relative strength index, or RSI, which is an important momentum indicator. The RSI for financials has been hitting high levels since mid-October, but, currently, it looks like it could be close to breaking down. If the RSI breaks down, Collins fears that the XLF could follow it down.
Ultimately, Collins thinks that the XLF could trade sideways between $23.75 and $25 for a while.
"In short, the daily chart of the big Standard & Poor's financial ETF is not looking as hot as we might expect, given that I think the banks are about to become some of the sexiest stocks imaginable," Cramer said.
However, all is not lost.
When Collins zoomed out to look at the XLF's weekly chart, it painted a prettier picture. He pointed out that the ETF has moved higher for two years until the sell-off in August. After that sharp decline, there has been a solid rebound and is now displaying a cup formation on the charts.
Read more from Mad Money with Jim Cramer
Cramer Remix: The party is over for this stock
Cramer: Stop trading Horizon like a mini-Valeant
Cramer's rate hike reality check—Get used to pain!
A cup formation is one formation that is part of a cup-and-handle pattern, which is one of the most bullish patterns to find in the chart world. In order for the XLF to display a cup-and-handle pattern, it needs to trade sideways for the next few months.
Collins thinks that the ETF could rally up to $28 within a three-month time frame. That would be a 14.5 percent increase from its current level, which is pretty significant. So, while the banks might consolidate in the short term, Collins can see this group headed higher in the long term.
"I certainly agree with his long-term forecast, because the moment the Fed raises interest rates, the earnings power for all the banks gets much stronger," Cramer said. (Tweet This)
That means Cramer wants investors to treat any pullback coming as a buying opportunity, especially for his favorite banks, like Wells Fargo and Bank of America.
Questions for Cramer?
Call Cramer: 1-800-743-CNBC
Want to take a deep dive into Cramer's world? Hit him up!
Mad Money Twitter - Jim Cramer Twitter - Facebook - Instagram - Vine
Questions, comments, suggestions for the "Mad Money" website? madcap@cnbc.com