Volatility is sitting near its lowest levels in years, but one technical strategist says that if history is any indication, the so-called fear gauge is signaling a market breakout.
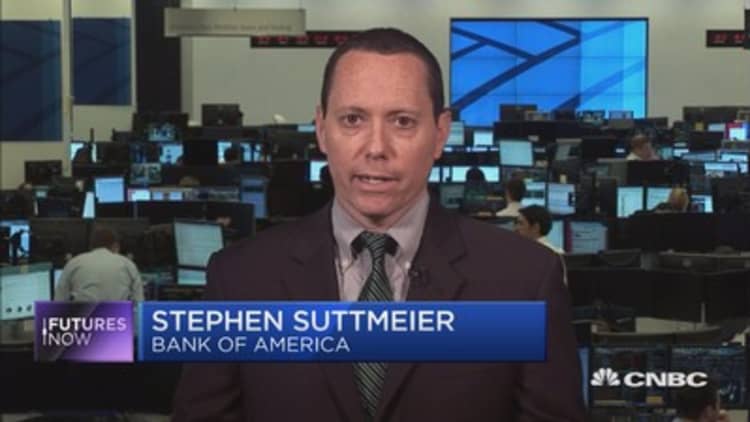
While the VIX hit a 10-year low Monday, Bank of America's Stephen Suttmeier said that it's the chart of the VXV-to-VIX ratio that points to a rally ahead for stocks.
The VXV is an index similar to the VIX, but it measures expected volatility over the next 93 days. In other words, it is a longer version of the VIX index that tells where the VIX is expected to go.
"When the VXV to the VIX goes from oversold to overbought really fast, [which has] happened about four times in the last year or so, the market tends to break out," Suttmeier explained Tuesday on CNBC's "Futures Now."
The strategist points out three key points through 2016 to illustrate his thesis. The VXV-VIX ratio first rose rapidly in February 2016, when the broke out above 1,950. The second time the increase occurred was right after the Brexit vote, following which the market went through 2,100. The third and final time was right after the election, when the S&P broke above 2,200.
And now, with another rise in the VXV-VIX ratio in April, Suttmeier thinks that the trend "favors a breakout through 2,400."
As a result, Suttmeier believes the S&P 500 could run up as high as 2,500 in the short term.
On the same segment, "Futures Now" trader Brian Stutland shared that data going back to 1991 showed that the VIX typically trades back above 16 within half a year after falling below 12. This is based on a Bollinger Band analysis, a volatility indicator with an upper and lower line that indicates whether an asset is overbought or oversold.
Stutland says that the VIX has yet to hit the lower Bollinger Band, which would indicate that the VIX is oversold. But once it does, there could be a spike higher in volatility.
The VIX index has hovered around 12 for most of the year so far.


