Skip navigation

Warren Buffett Watch


Current DateTime: 08:15:27 09 Feb 2012
LinksList Documentid: 24412036
Expiration DateTime: 2/9/2012 8:18:16 AM

RSS FEED

» Help

Current DateTime: 08:15:27 09 Feb 2012
LinksList Documentid: 30078629

MOST SHARED


Current DateTime: 08:15:27 09 Feb 2012
LinksList Documentid: 31330905
Expiration DateTime: 2/9/2012 8:18:45 AM

Current DateTime: 08:15:27 09 Feb 2012
LinksList Documentid: 23452000
Expiration DateTime: 2/9/2012 8:18:40 AM

Current DateTime: 08:15:27 09 Feb 2012
LinksList Documentid: 23452764
Expiration DateTime: 2/9/2012 8:18:24 AM

Berkshire Hathaway Ends Year With Biggest Stock Gain Since 1998

Published: Tuesday, 15 Jan 2008 | 6:54 PM ET
Text Size
By: Alex Crippen
Executive Producer

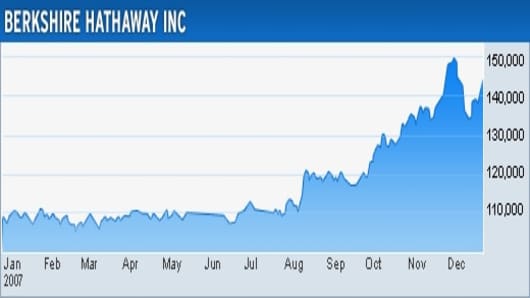
Berkshire Hathaway's stock has ended 2007 with its biggest annual percentage gain since 1998.

Shares in Warren Buffett's holding company closed just a few minutes ago at $141,600.  That's an increase of 28.7 percent from 2006's close of $109,990.

Berkshire shares haven't done better in any calendar year since 1998, when they soared 52.2 percent.  (They then proceeded to fall 20 percent the next year.)

Berkshire Hathaway 2007 Stock Chart
Berkshire Hathaway shares are up almost 29% in 2007, their best annual performance since 1998.  BRK.A hit an all-time intraday high of $151,650 on December 11.

While a nearly 30 percent gain is impressive, it's just below the average annual gain 30.4 percent for Berkshire Hathaway from 1977 to 2007.   Over that same period, Berkshire shares have grown from $89 at the end of 1976 to just under $142,000 today.  That's an increase of 159,001 percent.

Berkshire stock has also outperformed the S&P for the second straight year, after a string of three consecutive underperformances.

Here's the scorecard.  The years in which Berkshire beat the S&P are highlighted in blue.

  Berkshire Hathaway Stock vs. S&P 500 Index
  Annual Gains
YearBRK.A CloseBRK Pct. ChangeS&P CloseS&P Pct. Change
2007141,600+28.7%1468.36+3.5%
2006109,990+24.1%1418.30+13.6%
200588,620+0.8%1248.29+3.0%
200487,900+4.3%1211.92+9.0%
200384,250+15.8%1111.92+26.4%
200272,750-3.8%879.82-23.4%
200175,600+6.5%1148.08-13.0%
200071,000+26.6%1320.28-10.1%
199956,100-19.9%1469.25+19.5%
199870,000+52.2%1229.23+26.7%
199746,000+34.9%970.43+31.0%
199634,100+6.2%740.74+20.3%
199532,100+57.4%615.93+34.1%
199420,400+25.0%459.27-1.5%
199316,325+38.9%466.45+7.1%
199211,750+29.8%435.71+4.5%
19919,050+35.6%417.09+26.3%
19906,675-23.1%330.22-5.8%
19898,675+84.6%350.67+26.3%
19884,700+59.3%277.72+12.4%
19872,950+4.6%247.08+2.0%
19862,820+14.2%242.17+14.6%
19852,470+93.7%211.28+26.3%
19841,275-2.7%167.24+1.4%
19831,310+69.0%164.93+17.3%
1982775+38.4%140.64+14.8%
1981560+31.8%122.55-9.7%
1980425+32.8%135.76+25.8%
1979320+110.5%107.94+12.3%
1978152+10.1%96.11+1.1%
1977138+55.1%95.10-11.5%
Average+30.4%+9.8%

Happy New Year from Warren Buffett Watch and everyone at CNBC and CNBC.com

Questions?  Comments?  Email me at

© 2012 CNBC, Inc. All Rights Reserved


Current DateTime: 06:22:02 09 Feb 2012
LinksList Documentid: 29778428

Current DateTime: 02:53:04 09 Feb 2012
LinksList Documentid: 29779196

Current DateTime: 07:11:41 09 Feb 2012
LinksList Documentid: 29779197

Current DateTime: 02:53:04 09 Feb 2012
LinksList Documentid: 29779199
CNBCCNBC
About CNBC  |  Site Map  |  Video Reprints   |  Advertise  |  Help  |  Contact
Privacy Policy  |     |  Terms of Service  |  Independent Programming Report
  Data is a real-time snapshot  *Data is delayed at least 15 minutes
Global Business and Financial News, Stock Quotes, and Market Data and Analysis

© 2012 CNBC LLC.  All Rights Reserved.
A Division of NBCUniversal
Thomson ReutersThomson Reuters