

Trading in Chinese companies is a complex undertaking. Many firms like PetroChina and ChinaMobile are listed in Shanghai, Hong Kong and New York. Multi-listings are not unusual. What is unique, is the performance of Hong Kong's China Enterprise Index (CEI), where Chinese companies are listed.
Companies included on the CEI, also know as the Red Chip Index, are trading at an average 60 percent discount to their counterparts in Shanghai.
Many investors see the Red Chip Index as a proxy for the China's Shanghai Composite Index. However, the Red Chip Index has its own driving forces that make the link to mainland market performance less than certain. In this column, the Red Chip Index is analyzed and traded on its own merits, and not in reaction to activity in Shanghai except in a very broad sense.
The key historical feature is the sudden collapse of the bubble in November 2007. By mid-December the downtrend was well established. The long term Guppy Multiple Moving Averages (GMMA) had began to separate showing consistent investor selling into the rallies. The first technical target was support near 10,030. The market plunged to 12,000 and found a rebound point.
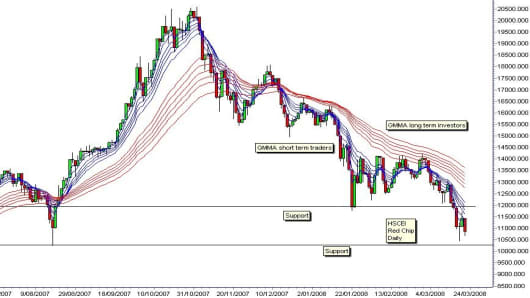
The 12,000 level is not a technical support level. This level has no previous history of acting as a support level. In the rising market of 2007 this level did not act as a consolidation level. It was not a resistance point, or a support point. This behavior suggests there is a low probability that 12,000 will develop into a substantial support level in the future. This has a low probability of becoming the level where the downtrend pauses, consolidates, and develops into a new uptrend.
The next support level is at 11,000, but this is weak. It acted as a resistance level in May and June 2007. This cannot be described as a significant pause in the rising trend. The level also acted as a rebound point in 2007 August, but it did not define the spike lows. These factors suggest it is a weak support level.
The nearest confirmed support level is near 10,030. This has a longer and more varied history of support and resistance. It acted as a resistance level in April 2007, then as a support level in May 2007. On a weekly chart, it appears as a resistance feature in November and December 2006. It also acted as support for the absolute low when the price dip appeared in August 2007. This is a pile driver pattern and shows the market probing for foundation support. The pile driver patterns is an indication of subsequent minimum lows. This combination of chart features suggest the strongest support level is near 10,030.
Achieving these targets does not set up the conditions required for a rapid change to an uptrend. There is a high probability of a consolidation developing between 10,030 and 11,000. The probability of a change to an uptrend increases when the long term group of averages begins to compress in response to new rallies. This is the opposite to the situation with the latest rally in late February. The long term GMMA did not compress and this confirmed the strength of the downtrend.
The 10,030 level provides an historically stable support level. Traders should remain alert for support and resistance behavior in the Red Chip Index independent of any behavior in the Shanghai or Shenzhen Indexes.
The difference in nature, correlation and character of trending behavior between the Red Chip Index and the mainland Chinese markets is explored in more detail in Daryl's article in the April and May editions of Stocks and Commodities magazine.
If you would like Daryl to chart a specific stock, commodity or currency, please write to us at ChartingAsia@cnbc.com. We welcome all questions, comments and requests.
CNBC assumes no responsibility for any losses, damages or liability whatsoever suffered or incurred by any person, resulting from or attributable to the use of the information published on this site. User is using this information at his/her sole risk.
