Current Housing Indicators |
| CURRENT | PREVIOUS | ||
| Existing Home Sales | 4.49m | ▼ | 4.74m |
| New Home Sales | 309,000 | ▼ | 344,000 |
| Housing Starts | 583,000 | ▲ | 477,000 |
| Building Permits | 547,000 | ▲ | 531,000 |
| HMI | 9 | UNCH | 9 |
| Existing Home Prices | $170,300 | ▼ (annually) | $199,800 |
| New Home Prices | $201,100 | ▼ (annually) | $232,400 |
- The Battered Businesses Behind Housing
- Watch Foreclosures, Seriously
- Home Buyer Tax Credit Expansion Heads to Obama
- Congratulations America, We're All Landlords Now
- Wells Fargo Bets on Housing Recovery
- Home Buyer Tax Credit Done: Does it Matter?
- Better Times for Mortgage Banking
- 'Beleaguered Big Builders' Sitting On Piles of Cash
- Home Buyer Tax Credit: Final Deal?
- A Compromise on Home Buyer Tax Credit?
MOST SHARED
- Home Prices Start to Stabilize In the US as Sales Pick Up
- Flaw in US Data Overstates Growth, Productivity
- Israel: Leader of Business Innovation
- Why Health Care Bill Is Facing Such a Tough Fight in Senate
- BofA Board in Civil War Over Lewis' Successor
- iPhone, App Strategy the 'New Dot Com?'
- Solid 3-Year Auction Gives Boost to Treasury Prices
- S&P Stocks Trading at New 52-Week Highs
- Health Care Bill Worst Law Since 1930s: Forbes
- Dow Up Over 100 After G20 Stimulus Pledge
- Warren Buffett to Sell Stakes In Union Pacific & Norfolk Southern
- Nov. 9: Unusual Volume Leaders
- The Battered Businesses Behind Housing
- Modern Warfare 2's Record-Breaking Launch
- Merck’s Mega-Monday Morning
- Why are Traders Bullish on This Food Company?
- Profiting From Natural Gas: Strategists
- S&P Stocks Trading at New 52-Week Highs
- Shopping for Answers
- Who Were Winners & Losers This Past Year? You Tell Us
- Time Is Here to Look at Overseas Stocks: Bill Gross
- Buffett to Sell Stakes in Norfolk Southern, Union Pacific
- 'Modern Warfare 2' May Be Biggest Event This Year
- Home Prices Start to Stabilize In the US as Sales Pick Up
- Flaw in US Data Overstates Growth, Productivity
- Do You Know Your Coca-Cola Myths?
- BofA Board in Civil War Over Lewis' Successor
- Goldman Sachs Head Says Banks Do 'God's Work'
RSS FEED
Realty Check
I want first to give a shout-out to Debi Averett, the brains behind HousingDoom.com, for sending me this very significant insight into yesterday’s numbers from the National Association of Realtors. And a chart! Love charts (see below).
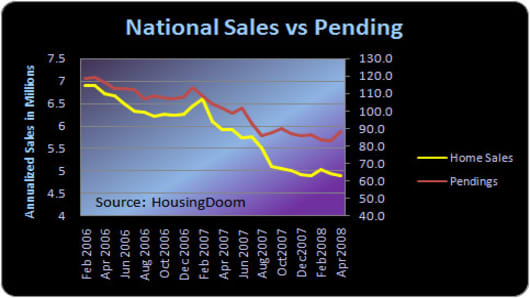
The chart has two metrics, one on each side, because the NAR measures existing home sales (based on closings) in real numbers but measures pending home sales (contracts signed, not closings) as an index. The comparison, while not totally scientific, shows the trend pretty clearly.
Back in 2006 the Pending Home Sales Index tracked closely with the real Existing Home Sales numbers, showing that contracts signed did in fact jibe with real closed sales. But come summer of last year (and the start of the credit crisis), you can see those lines diverge, and they’re still going. What’s the reason? Could be that folks signing contracts are just not getting the financing or they’re canceling for other reasons. In any case, not all contracts signed are turning into closings, and the trend in April shows the divergence increasing.
I think that’s important to note in this dicey housing market, where every number is broadcast everywhere as an indicator of when the housing market will bottom, or when it won’t. Everyone got all excited yesterday that the Pending Home Sales Index rose 6.3% month to month.
I would caution that this chart shows all those contracts signed may not result in actual closed sales. I also think it’s very important to note that year-over-year numbers are far more indicative of where we are in the market. I’m all for incremental improvements, but let’s not let one number carry us away from reality.
![]() |
Questions? Comments?


