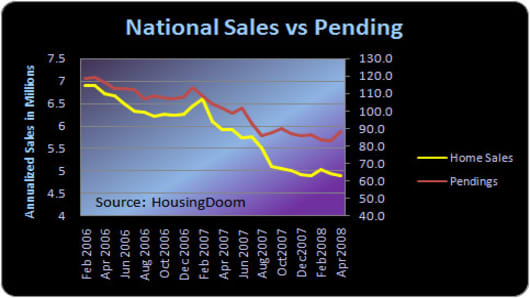
I want first to give a shout-out to Debi Averett, the brains behind HousingDoom.com, for sending me this very significant insight into yesterday’s numbers from the National Association of Realtors. And a chart! Love charts (see below).
The chart has two metrics, one on each side, because the NAR measures existing home sales (based on closings) in real numbers but measures pending home sales (contracts signed, not closings) as an index. The comparison, while not totally scientific, shows the trend pretty clearly.
Back in 2006 the Pending Home Sales Index tracked closely with the real Existing Home Sales numbers, showing that contracts signed did in fact jibe with real closed sales. But come summer of last year (and the start of the credit crisis), you can see those lines diverge, and they’re still going. What’s the reason? Could be that folks signing contracts are just not getting the financing or they’re canceling for other reasons. In any case, not all contracts signed are turning into closings, and the trend in April shows the divergence increasing.
I think that’s important to note in this dicey housing market, where every number is broadcast everywhere as an indicator of when the housing market will bottom, or when it won’t. Everyone got all excited yesterday that the Pending Home Sales Index rose 6.3% month to month.


