

Asian stocks fell to a two-year low Tuesday with most markets down at least 2 percent if not more. Investor confidence in the region's financial sector has waned due to high inflation, a stricter lending environment and massive volatility from overseas markets, especially the U.S..

In Asia, investors' willingness to take risks has been further drained by a shift in focus from lending institutions that are believed to be too big to be allowed to fail, to ones that are small enough to collapse. On Monday the S&P financial sector index fell to its lowest in nearly a decade.
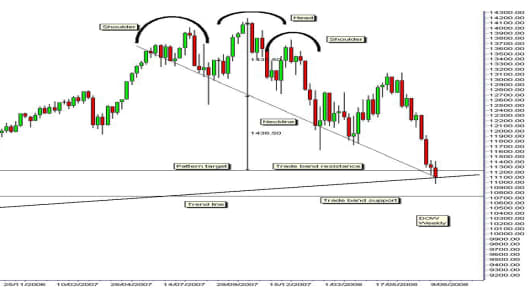
The contamination of the credit crisis continues to beat up the Dow Jones Industrial Average. The chart suggests there is more pain to come with this, the equivalent of a root canal rather than a simple toothache.
The bear head and shoulder pattern for the Dow index was confirmed in January. The head and shoulder pattern started with the rally and retreat in 2007 July. The head of the pattern developed in 2007 October. The right shoulder developed with the rally and retreat in 2007 December. The downside target for this pattern was near 11,200 and has been achieved this month.
The bear was clearly visible to anybody who had even the most basic charting knowledge. This information allowed these traders to develop defensive tactics to protect profits and capital. They avoided the wealth destruction that occurred in January. They avoided entering the false rally when some suggested that the Fed's action in bailing out Bear Stearns signaled the end of the financial crisis.
Basic chart analysis protected traders, allowing them to trade the short side of the market with confidence. They traded the rally in April as a short-term trend within the context of a longer-term developing bear market.
The key question since January has not been, "Are we in a bear market?”, but rather, “What are the conditions that will signal the end of a bear market?”. Traders now look for trend reversal patterns or conditions.
The first element of these reversal conditions is existing support levels. The long-term uptrend line starts in way back in August 2004. This line has a gentle slope. Its current value is near 11,100. But traders are also looking for other support features on the chart.
The most important of these support features is the long-term trading band. The upper edge of this band developed in 2004 February. It continued to provide either a resistance level, or a support level until 2006 July. This suggests this is a strong support level and it is located near 10,700 and has a higher probability of acting as the first consolidation support area for any trend reversal in the Dow.
The lower level of this band is located near 9,800. A fall to the 9,800 level would equal a 30 percent fall from the Dow high in October 2007, near 14,100.
The normal pattern for a trend reversal in the Dow is a test and rebound from a well defined support level. This is often a double-bottom pattern. Currently this may develop near the 10,700 support.
If this double-bottom rebound pattern does not develop in the next few weeks then traders will look for a “W” pattern of fast rally, retreat and rebound.
The Nasdaq head and shoulder pattern provides some indication of how a reversal develops. A successful retest of the Nasdaq head and shoulder pattern support level at 2,200 indicates the development of a “W” pattern of recovery. As we noted in April, the Nasdaq leads and the Dow follows. Traders watch for the first leg of the rebound to develop from between 10,700 and 11,200. And just as with root canal work, there is a lot of expensive pain to come before we get the all clear.
If you would like Daryl to chart a specific stock, commodity or currency, please write to us at ChartingAsia@cnbc.com. We welcome all questions, comments and requests.
CNBC assumes no responsibility for any losses, damages or liability whatsoever suffered or incurred by any person, resulting from or attributable to the use of the information published on this site. User is using this information at his/her sole risk.
