

In one of my past incarnations, I was -- I kid you not -- a gold miner. Yes, I actually worked underground in an Australian goldmine. Since then I have found it much easier, and much more profitable, to mine for gold in the financial markets. Here, gold is a mother lode of opportunity, as indicated by the weekly NYMEX chart.

AP
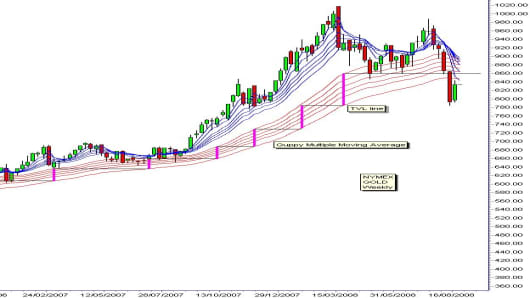
Just like physical gold visible in the rock face, the gold chart shows high grade values, and areas where value is less profitable. The plunge from $990 to $780 has traders worried that this vein may be played out because gold prices have hit the same volatility skids that have been plaguing the global equity markets this year.
The essential difference is the volatility of price and the volatility of the trend. In a strong trend, we accept price volatility because it does not threaten the stability of the trend. The most important feature is the volatility of the trend. But when prices plunge below a measure of trend volatility, it's a strong signal that the trend is ending.
The Guppy Multiple Moving Averages (GMMA) is used to understand the behavior of investors and traders. The investors provide trend stability. The changes in the relationship in the long-term GMMA group of averages indicate changes in the volatility of the trend. This trend volatility is measured with a GMMA Trend Volatility Line (TVL) . A closing price below the TVL confirms significant trend weakness. This is a leading indicator.
The TVL analysis applied to the gold chart shows the move below $860 is a significant change in the uptrend. The focus now shifts to defining the potential downside for the new trend. Gold is no longer a long-side trading opportunity.
The gold market has been defined by strong horizontal support and resistance levels. These levels are created when prices move sideways within the trading channel defined by the sloping trend lines.
In June 2007, gold moved below the lower up trend line and developed a horizontal support level near $650.00. In late 2007, gold developed a new horizontal support level or trading band, near $785 to $840. Current price activity falls within this trading band.
There is a strong probability gold will develop another sideways pattern similar to the that in 2007 June. In this condition, gold will use the $785 to $840 level as a trading band. This pattern of support suggests gold can fall to this level and move sideways. Optimists draw a long-term trend line starting in July 2005 and touching the lows in June 2007. This trend line provides support in the $785 to $840 region.
The plunge in recent weeks has exhausted the nuggets of opportunity found in March through July of this year. The move below the TVL line confirms a significant trend change. This is unsafe and shifting ground. The key uptrend continuation signal is a move above $840. The warning signs of further shaky ground is a fall below support near $785, or a fall below the value of the long term trend line.
A fall below the TVL line at $860 is a signal for a change in the long-term uptrend. The strongest support level is between $650 and $700. A sustained fall below support at $780 has a long-term downside target near $650 to $700.
The strong trend in gold has its own characteristics and traders must understand this behavior. The trend is influenced by U.S. dollar weakness, but this is not the most important feature of the trend. Traders watch for the price behavior within the horizontal support areas.
It's time to hang onto your hard hats and trade the volatility of price behavior rather than the trend behavior. Capture the nuggets while waiting for the line of lode to reveal itself again with a move above the TVL line.
If you would like Daryl to chart a specific stock, commodity or currency, please write to us at ChartingAsia@cnbc.com. We welcome all questions, comments and requests.
CNBC assumes no responsibility for any losses, damages or liability whatsoever suffered or incurred by any person, resulting from or attributable to the use of the information published on this site. User is using this information at his/her sole risk.
