Skip navigation
MOST POPULAR RELATED TAGS
  • TOPICS
  • SECTORS
  • COMPANIES

RSS FEED

» Help

Current DateTime: 04:35:16 12 Jul 2009
LinksList Documentid: 30078629
Buffett Watch
Text Size
Jan.01
9:52 AM ET
Thursday, 1 Jan 2009
Buffett's Berkshire Hathaway Drops 32% In 2008, But Still Beats S&P For Third Straight Year

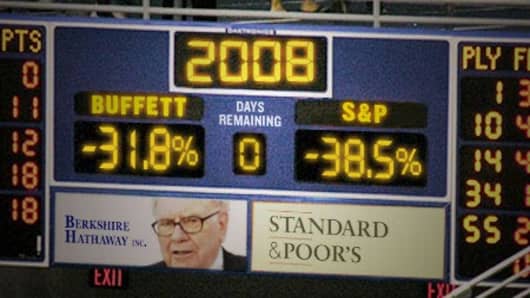
Shares of Warren Buffett's Berkshire Hathaway lost almost a third of their value in 2008, but the stock still managed to outperform the benchmark S&P 500 stock index for the third consecutive year.

Berkshire's Class A shares ended the year at $96,600 each.  That's a drop of 31.8 percent from 2007's closing price of $141,600.  It's Berkshire's worst performance in the roughly three decades for which we have data.

The S&P fell 38.5 percent during 2008, excluding dividends, its worst year since 1931.

CNBC.com Photo Illustration

Berkshire suffered steep losses in the fourth quarter of the year.  On September 19, it closed at its highest point of the year: $147,000.

Berkshire Hathaway (BRK.A) in blue vs. the S&P 500 (SPX) in orange
Berkshire Hathaway (BRK.A) in blue vs. the S&P 500 (SPX) in orange, during 2008

The lowest close of the year came just two months later: $77,500 on November 20.  That's a drop of 47.3 percent over 8 weeks.   Apparently sparking the selling: Berkshire's disappointing third quarter earnings report, including big paper losses on long-term bets that stocks will eventually recover.  

Berkshire PortfolioGo to Berkshire Hathaway Portfolio Tracker
It proved to be a short-term buying opportunity.  The year-end close is 24.7 percent above that November low. Buffett's late-November promise to deliver more information on those derivative positions appeared to help the stock.  Barron's also called Berkshire "cheap" around the same time.

Over the past three years, Berkshire's stock is up 9.0 percent, while the S&P is down 27.6 percent.

Since 1977, Berkshire has outperformed the S&P in 24 out of 32 years.  Buffett's average annual gain is 28.4 percent, compared to 8.3 percent for the S&P.

Here's the updated scorecard. Berkshire's winning years are highlighted in blue.

  Berkshire Hathaway Stock vs. S&P 500 Index
  Annual Gains
YearBRK.A CloseBRK Pct. ChangeS&P CloseS&P Pct. Change
200896,600-31.8%903.25-38.5%
2007141,600+28.7%1468.36+3.5%
2006109,990+24.1%1418.30+13.6%
200588,620+0.8%1248.29+3.0%
200487,900+4.3%1211.92+9.0%
200384,250+15.8%1111.92+26.4%
200272,750-3.8%879.82-23.4%
200175,600+6.5%1148.08-13.0%
200071,000+26.6%1320.28-10.1%
199956,100-19.9%1469.25+19.5%
199870,000+52.2%1229.23+26.7%
199746,000+34.9%970.43+31.0%
199634,100+6.2%740.74+20.3%
199532,100+57.4%615.93+34.1%
199420,400+25.0%459.27-1.5%
199316,325+38.9%466.45+7.1%
199211,750+29.8%435.71+4.5%
19919,050+35.6%417.09+26.3%
19906,675-23.1%330.22-5.8%
19898,675+84.6%350.67+26.3%
19884,700+59.3%277.72+12.4%
19872,950+4.6%247.08+2.0%
19862,820+14.2%242.17+14.6%
19852,470+93.7%211.28+26.3%
19841,275-2.7%167.24+1.4%
19831,310+69.0%164.93+17.3%
1982775+38.4%140.64+14.8%
1981560+31.8%122.55-9.7%
1980425+32.8%135.76+25.8%
1979320+110.5%107.94+12.3%
1978152+10.1%96.11+1.1%
1977138+55.1%95.10-11.5%
Average+28.4%+8.3%

Happy New Year from Warren Buffett Watch, and from everyone at CNBC and CNBC.com.

Current Berkshire stock prices:

Class A: [US;BRK.A  Loading...      ()   ]

Class B: [US;BRK.B  Loading...      ()   ]

Questions?  Comments?  Email me at

© 2009 CNBC, Inc. All Rights Reserved

Tools:
PrintEmailAdd This share icon
Next Post


Current DateTime: 01:07:48 12 Jul 2009
LinksList Documentid: 29778428

Current DateTime: 01:05:38 12 Jul 2009
LinksList Documentid: 29779196

Current DateTime: 01:06:33 12 Jul 2009
LinksList Documentid: 29779199

Current DateTime: 01:07:48 12 Jul 2009
LinksList Documentid: 29779198
CNBCCNBC
About CNBC  |  Site Map  |  Privacy Policy  |  Terms of Service  |  Video Reprints  |  Advertise  |  Help  |  Contact
Partners: AOL Money  |  BloggingStocks.com
CNBC is a Division of NBC Universal
  Data is a real-time snapshot *Data is delayed at least 15 minutes
Global Business and Financial News, Stock Quotes, and Market Data and Analysis

© 2009 CNBC, Inc.  All Rights Reserved.
Thomson ReutersThomson Reuters